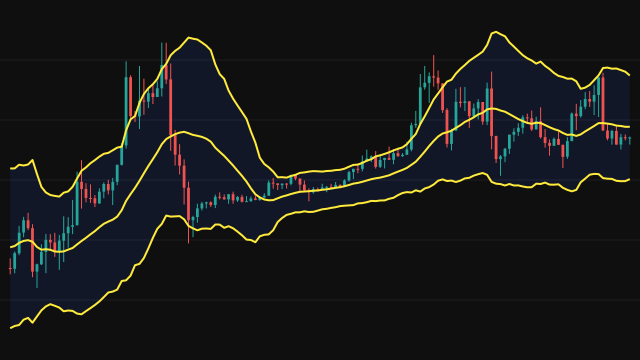
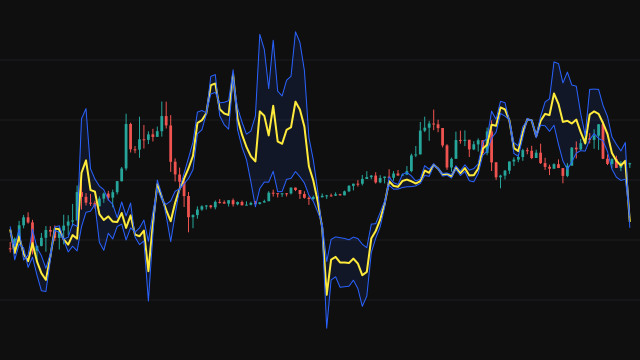
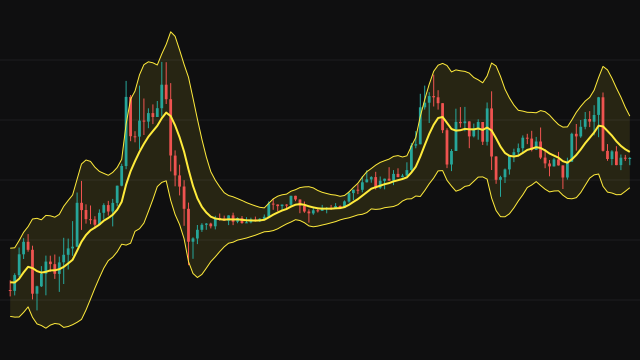
Aberration draws a channel around a moving average of the source. The width of the channel comes from the average absolute deviation: on each bar the study takes the distance between the source and the average, ignoring its sign, and then takes a simple average of those distances over the same period. The upper band is the average plus a multiple of that figure and the lower band is the average minus it.
The centre line can be a simple, exponential, weighted, running (RMA) or low-lag HMA average, chosen from a menu. The exponential choice starts from the first value rather than from a simple average, so it answers from the first bar. During the warmup of the average, the distance is measured against zero, exactly as the calculation reads a missing value as zero.
Because absolute deviation weighs every distance equally rather than squaring it, a single large bar moves these bands less than it moves a band built on standard deviation.
How to read Aberration (ABBER)
Price that holds near the centre line is trading inside its usual range. A close beyond the upper or lower band means price has moved further from the average than it typically does over the period, which some traders read as a breakout and others as stretched. Widening bands show dispersion growing; narrowing bands show it shrinking.
The bands follow the average, so they lag a sharp turn by roughly the period. A move outside them says the move is unusual for the recent past, not that it will continue or reverse.
Settings
- Source
- The price series the average and the deviations are measured on, the close by default.
- Period
- The number of bars in the moving average and in the average of the absolute deviations. Longer is smoother and slower.
- Moving Average Type
- The kind of average used as the centre line: simple, exponential, weighted, running (RMA) or low-lag HMA.
- Deviation Multiplier
- How many average absolute deviations the bands sit from the centre line. A larger value gives a wider channel.
- Show Moving Average Line
- Draw the centre line between the bands, or hide it and keep only the two bands.
Frequently asked questions
How is this different from a standard deviation band?
It measures spread with the average absolute distance from the mean rather than the root of the squared distances. Large outliers count for less, so the bands react less to one extreme bar.
Why are the bands missing on the first bars?
The bands need both the moving average and a full window of deviations. They appear once the average of the deviations has a full period behind it.
Does changing the average type change the width?
Yes. The deviations are measured from whichever average is selected, so a faster average sits closer to price and usually gives narrower bands.