
Quickstart
Open the Scripts panel in /trading, write a first study, save it and put it on an NSE chart in about five minutes.
On this page
This page takes you from an empty Scripts panel to your own study drawn on an NSE chart, then shows you how to change its settings, find it again and read an error. It takes about five minutes and assumes nothing beyond an OpenAlgo login. Every step names the real button you press.
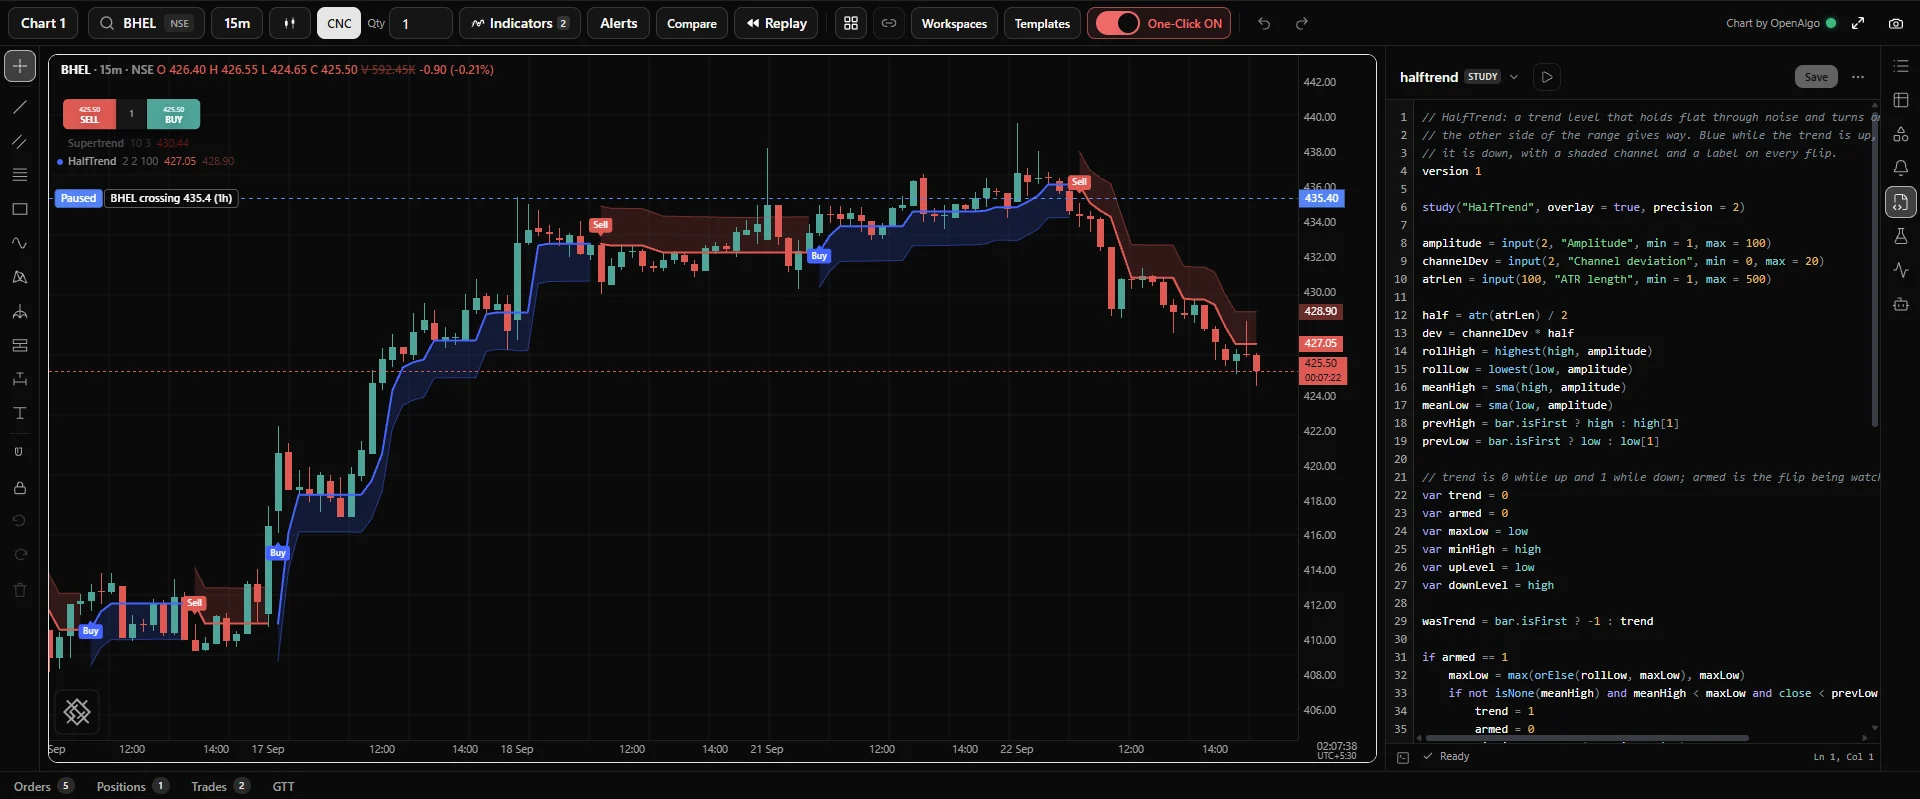
Before you start
You need three things:
- OpenAlgo running, and you logged in. Open the /trading page.
- An API key. The chart reads market data with your OpenAlgo API key. If the page says "No API key found for charting.", follow its Generate an API key link, create one, and come back.
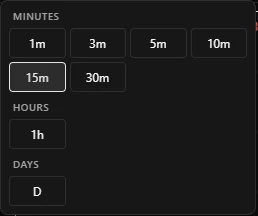
- A chart with some history. Click the symbol button at the left of the chart's toolbar (it reads Search symbol until a symbol is loaded), search for an NSE stock such as RELIANCE, and pick 15m from the timeframe button beside it. Any instrument works. On a 15 minute chart, /trading loads about two months of history, which is plenty for the averages on this page.
1. Open the Scripts panel
The right-hand edge of /trading is a toolbar of panels: Watchlist, Option chain, Objects, Alerts, Scripts, Backtest, Strategies and Assistant. Click Scripts (hover a button to see its name). The panel opens beside the chart. Click the same button again, or press Esc when the cursor is not in the editor, to close it.
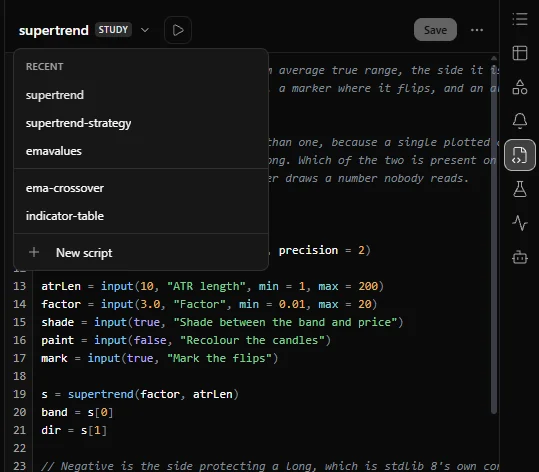
The first time, the panel says "Nothing written yet." and offers a New script button. Later, it reopens the script you last opened, and the script's name at the top of the panel is a menu of every script you have saved.
2. Create a study
Click New script. A small form opens at the top of the panel:
- Name. Type
ema-cross. A name can hold letters, digits, dots, dashes and underscores, starts with a letter or a digit, and is at most 64 characters long. It becomes the file nameema-cross.oscript. - Kind. Leave Study selected. The hint under it reads "Computes and draws on the chart."
- Click Create, or press Enter.
The editor opens with a starter study already in it, titled from the name you typed:
version 1
study("Ema cross", overlay = true)

length = input(20, "Length")
average = sma(close, length)

plot(average, "Average", aqua)
That is a complete, working study: a 20 bar simple moving average drawn on the price. You could apply it now. Instead, make it a little more useful.
3. Write the study
Select everything in the editor and replace it with this:
version 1

study("EMA cross", overlay = true, precision = 2)

fastLen = input(9,  "Fast length", min = 1, max = 500)
slowLen = input(21, "Slow length", min = 1, max = 500)
src     = input(close, "Source")

fast = ema(src, fastLen)
slow = ema(src, slowLen)

fastPlot = plot(fast, "Fast", aqua, width = 2)
slowPlot = plot(slow, "Slow", orange, width = 2)
fill(fastPlot, slowPlot, fade(aqua, 90))

if crossUp(fast, slow)
    signal("BUY")

if crossDown(fast, slow)
    signal("SELL")
What each part does:
| Line | Does |
|---|---|
version 1 | Fixes the language version, so the file means the same thing under every later release |
study(..., overlay = true, precision = 2) | Names the study, draws it on the price pane and shows two decimals in its legend |
input() | Creates a setting with a default, a label and, for a number, limits. input(close, "Source") offers a menu of price series. You change any of them later without editing the file |
ema() | Exponential moving average of the source over the given number of bars |
plot() | Draws one line. The title ("Fast") is what the legend and the settings dialog call it |
fill() | Shades between the two plotted lines. fade() makes aqua 90 percent transparent |
crossUp(), crossDown() | True on the bar where the fast average crosses above, or below, the slow one |
signal() | Puts a labelled marker on that bar |
Indent the two signal lines with four spaces. OpenScript uses indentation to mark a block, and a tab in the indentation is an error (OS1002). The editor's Tab key does not insert spaces, so type the spaces yourself.
4. Save it
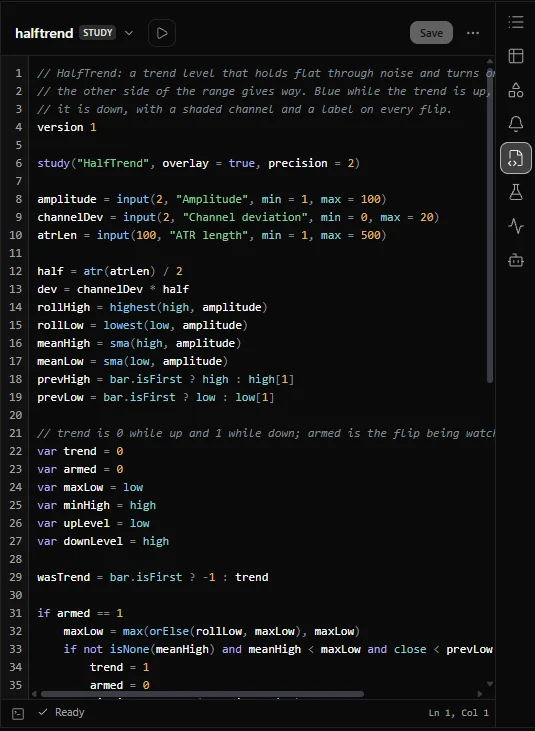
Click Save, or press Ctrl+S (Cmd+S on a keyboard with a Command key). Saving compiles the script, which means the compiler reads it and checks it for mistakes, then writes it to OpenAlgo. The picture shows the panel just after saving a longer study, the HalfTrend from Example scripts, with Ready in the status bar:
Watch the status bar at the bottom of the panel. While you type it says Unsaved changes. After the save it says one of these:
| Status bar | Means |
|---|---|
| Ready | The script compiled with nothing to report. You can apply it |
| Ready, with 1 warning | It compiled and will run; the console has a note worth reading |
| 1 error, so it will not run yet | It was saved, but it does not compile. Open the console to see why |
The editor colours the text with the language's own highlighter, and the right end of the status bar shows where your cursor is, as Ln and Col.
5. Put it on the chart
Click Apply to chart: the play button beside the script's name at the top of the panel. It is enabled once the script is saved and compiles; until then, hovering it says "Save a script that compiles, and it can be applied to the chart."
The study appears on the chart: two moving averages over the candles, the band between them shaded, and BUY and SELL labels on the bars where they cross. A legend row named EMA cross, followed by its settings (9 21 close), appears at the top left of the chart.
The picture shows a 20 and 50 bar variant of this study on a daily SBIN chart, with the band shaded green where the fast average leads and red where the slow one does, and the crossings labelled Golden cross and Death cross. Its code is EMA cross in colour in Example scripts:
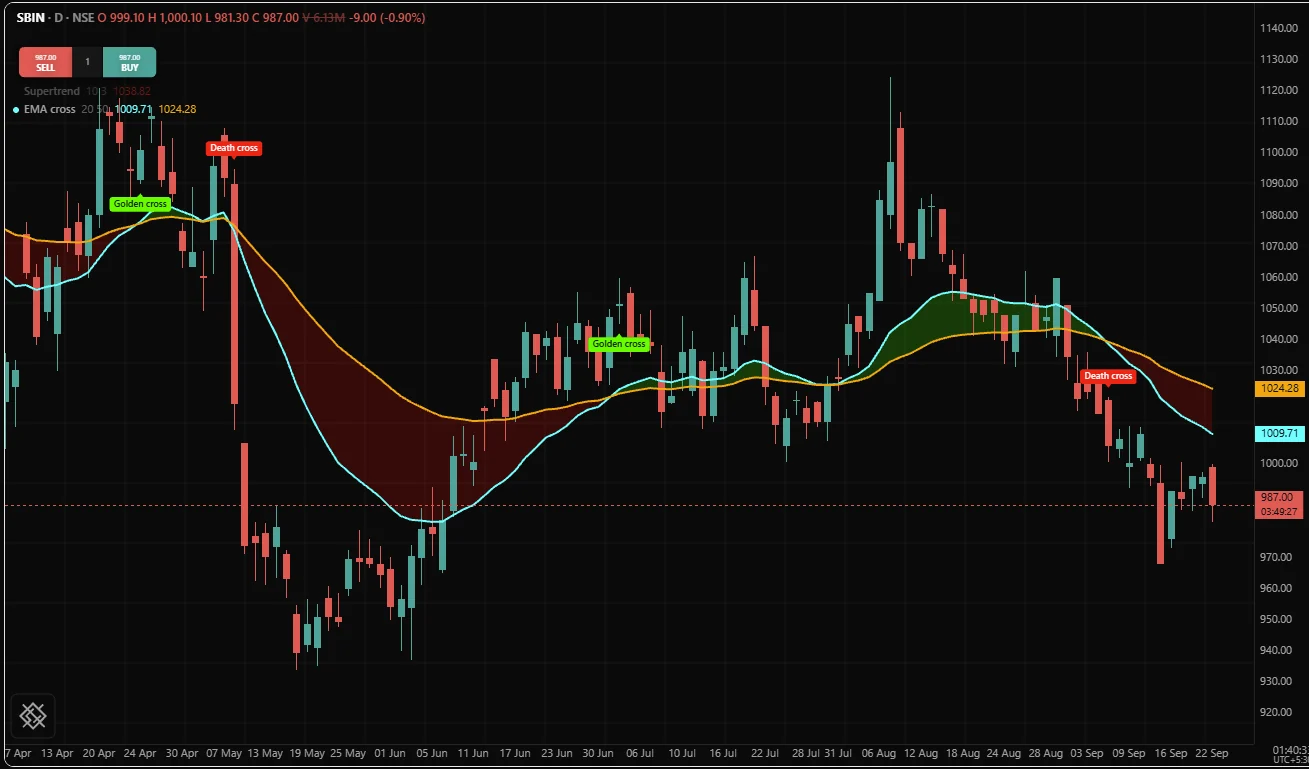
Both lines start a little way in from the left edge of the history. That is correct. A 21 bar average has no value until 21 bars exist, so OpenScript leaves the first bars empty rather than drawing a made-up number. The Warmup page explains the exact rule.
If a message says the study "needs more history than the bars loaded, so it has nothing to draw yet", the chart holds fewer bars than the longest average needs. The chart shows that message for any study that has no value on any loaded bar. Scroll the chart back to load older bars, or pick another timeframe.
6. Change a setting
Click the gear button on the study's legend row. The settings dialog opens with two tabs:
- Inputs holds one field per
input()in your script: Fast length and Slow length with the limits you gave them, and Source as a menu. - Style holds one row per plot, named by its title (
FastandSlow), with a checkbox to show or hide it and a button for its colour, opacity, thickness and line style.
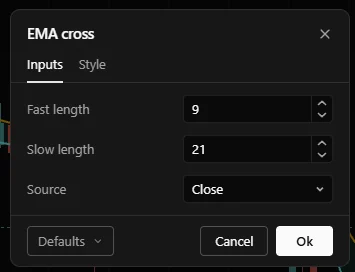
Change Fast length to 5 and click Ok. The chart recomputes at once; the script itself is unchanged. Defaults at the bottom left puts the fields back to the values the script declares.
7. Find it again
Your study now lives in OpenAlgo, not in this browser tab. To add it to any chart later:
- Click Indicators in the chart's toolbar.
- Under Yours, click My scripts.
- Click EMA cross.
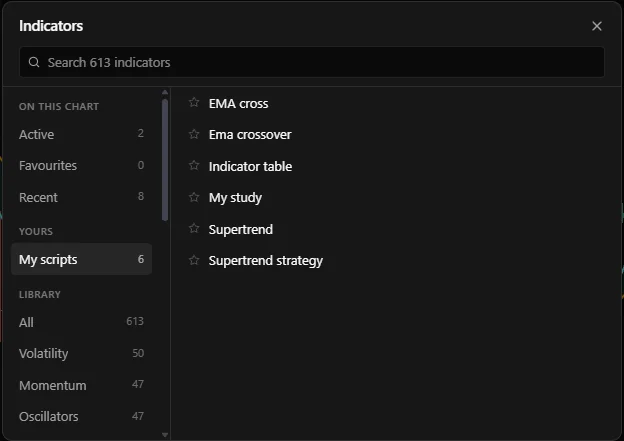
A script appears under My scripts as soon as it is saved and compiles, above the built-in indicators under Library. The study's legend row also carries a braces button, {}, beside the gear, which opens its source in the Scripts panel. From any chart you are one click from the code that drew it.
8. Read an error
Mistakes are part of writing a script, and every error comes with its cause and a fix. Try one on purpose. On line 9 of your study, change fastLen to fastlen, with a small l:
fast = ema(src, fastlen)Save. The status bar reads 1 error, so it will not run yet, the number 9 turns red in the gutter, and the console button at the left of the status bar turns red and shows 2, the number of messages waiting. Click it to open the console. Among the entries is this one:
OS2001  line 9, column 17
fast = ema(src, fastlen)
                ^^^^^^^
fastlen is not defined at this point in the file.
Fix: Assign fastlen above this line, move this line below its assignment, or correct the spelling to fastLen.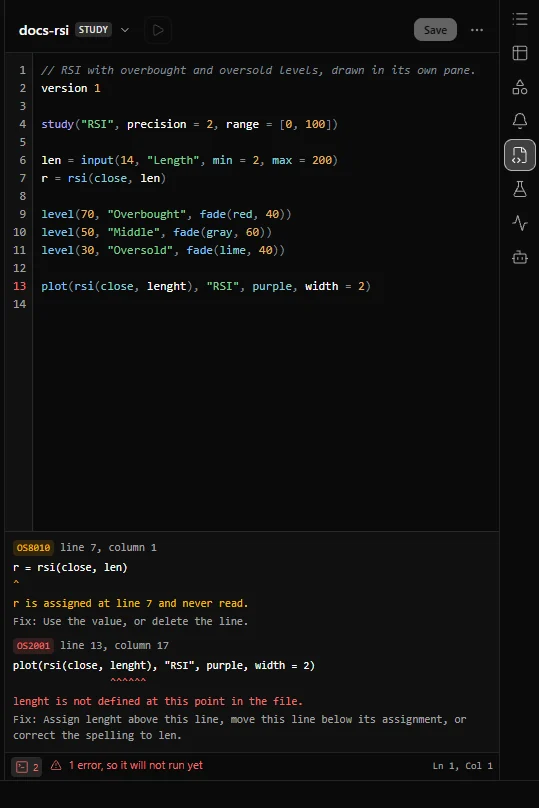
The code, OS2001, is stable, so you can look it up on the errors pages. The fix names the exact change: the input is called fastLen, with a capital L. The second message is a warning, OS8018: the Fast length input is never read, which is true while the typo stands. A warning never stops a script from running. Correct the spelling, save, and the status bar returns to Ready.
What you have now
- A file,
ema-cross.oscript, saved in OpenAlgo and listed in the Scripts panel's menu. - A study on the chart, with a settings dialog built from its inputs.
- The same study one click away in the Indicators dialog, on any chart and any instrument.
Where to go next
- Your first strategy turns this study into a strategy and backtests it in the Backtest panel.
- The editor covers every control in the Scripts panel.
- Example scripts has twelve complete scripts to read and adapt.
- Execution model explains why a script runs once per bar, which explains most of the language.
Related. Introduction, Inputs, Plots, Labels and shapes, Reading an error, Troubleshooting