
Alerts in /trading
Create price, study and drawing alerts on the /trading chart, alert on a condition your OpenScript study computes, see what a script's own alert() does there, and read the Alerts and Log tabs of the Alerts panel.
On this page
This page is about alerts as you meet them on the /trading page of OpenAlgo: setting a price alert with one right-click, putting an alert on a study's line (including a study you wrote in OpenScript), what an alert() in your script does on the chart in this release, how each firing reaches you, and how to read and manage everything in the Alerts panel on the right-hand toolbar. For writing alert() calls in a script, see Alerts from scripts.
Four kinds of alert
| Kind | What it watches | How you create it | Listed in the Alerts tab |
|---|---|---|---|
| Price alert | The instrument's price against a level or a channel | Right-click the price pane, or the Alerts button on the chart toolbar | Yes |
| Study alert | One plot of a study on the chart, built-in or your own script, against a value | Right-click the study's line, or the Alerts button | Yes |
| Drawing alert | A level of a drawing, such as a trend line | Right-click the drawing, or the Alerts button | Yes |
| Script alert | An alert() call in an OpenScript study on the chart | Nothing to create: it is watched once the study is on the chart | No. Any firing appears in the Log tab |
The first three are alerts you set on the chart, and each has a row in the Alerts tab with its own settings. The fourth is written into the script itself: its condition and message come from the code. In this release a script alert rarely fires on the chart (see Alerts from a script), so to be told about a condition your script computes, use a study alert on a plot of it, as Alerts on a script condition shows.
A price alert in one click
- Right-click the price pane at the level you want to watch.
- Choose Create price alert at followed by the price, for example
Create price alert at 812.45.
The alert is made there and then, with no form in between. A toast confirms it, such as Alert set: SBIN crossing 812.45, and a line appears across the chart at the level. The price is rounded to the instrument's tick size, so a point picked between two ticks becomes a price the instrument can actually trade at.
A right-click alert takes these settings, and every one can be changed afterwards with Edit on its row:
| Setting | Value |
|---|---|
| Condition | Crossing |
| Evaluate | Intrabar touch |
| Repeat | Only once |
| Expiration | Two months from now |
| When it fires | Sound and Desktop notification |
| Alert name | Written from the alert, such as SBIN crossing 812.45 |
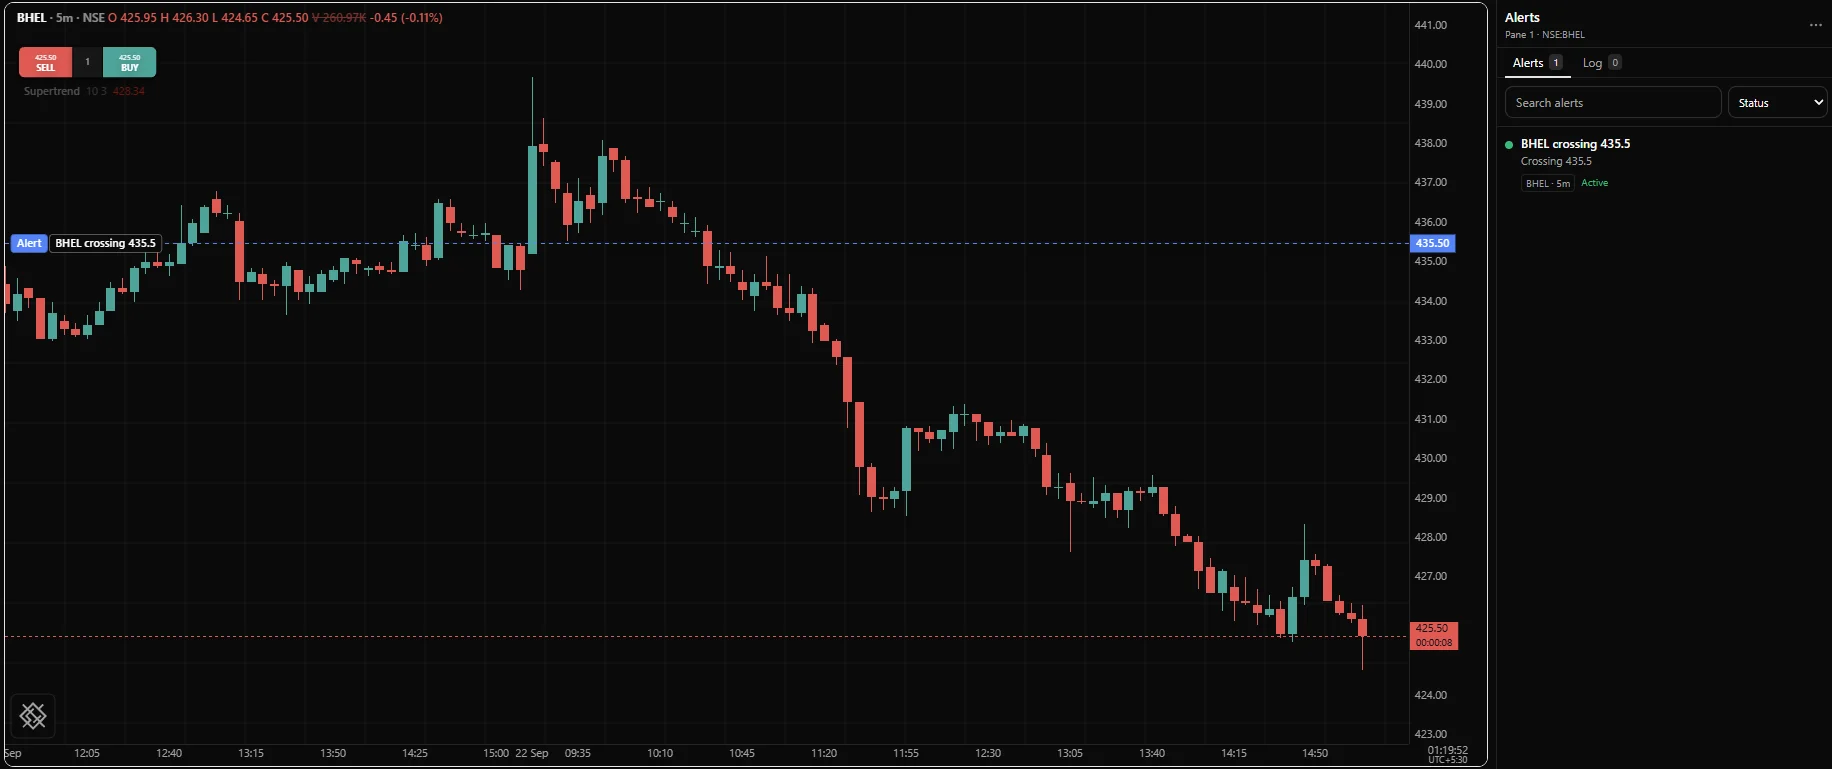
To move a price alert, drag its line. The new price is rounded to the tick, and a name the page wrote for you follows the new price; a name you typed yourself is left alone.
The Create alert dialog
Click Alerts on the chart toolbar, beside Indicators, to open Create alert for the chart in that pane. The line under the title names the instrument, such as SBIN on this chart. The same dialog opens as Edit alert from the Edit action on a row of the Alerts panel, with Save in place of Create.
The dialog reads top to bottom as a sentence: what to watch, when to fire, when to stop, what to call it and how to tell you.
Condition
What to watch picks the source:
| What to watch | Then choose | Value |
|---|---|---|
| Price | Nothing more | A price, seeded with the latest close |
| Study plot | Study (numbered as in the chart legend, such as 1: RSI) and Plot | A value in the plot's own units, seeded with the plot's latest value |
| Drawing level | Drawing (each drawing by its tool and a number) and Level | None: the drawing supplies its own level on every bar |
The list also offers Candle condition, but the dialog has no control yet for picking which candle pattern to watch, so saving one stops at "Choose a candle condition."
Condition then decides what counts as a hit:
| Condition | Fires when the watched value |
|---|---|
| Crossing | Moves from one side of the level to the other, in either direction |
| Crossing up | Moves from at or below the level to above it |
| Crossing down | Moves from at or above the level to below it |
| Greater than | Is above the level |
| Less than | Is below the level |
| Entering channel | Moves from outside the band between Lower and Upper to inside it |
| Leaving channel | Moves from inside that band to outside it |
The two channel conditions replace the single value box with Lower and Upper. Greater than and Less than test a state rather than a crossing: with Repeat set to Every time they fire again on every bar the value stays beyond the level, so pair them with Only once unless you want to hear about it again.
Trigger
| Control | Choices |
|---|---|
| Repeat | Only once: fire the first time, then show as Fired. Every time: keep watching after each firing, firing at most once per bar |
| Evaluate | On bar close or Intrabar touch |
The hint under Evaluate says what each one costs. On bar close: "Fires on a confirmed bar. A wick that is later revised will not fire it." Intrabar touch: "Fires the moment price touches, including on a wick that final history may not keep." On bar close is the same rule an OpenScript alert() follows by default. Intrabar touch is quicker and noisier, and it is what every new alert starts with.
Expiration
Tick Expires and pick a date and time, or leave it unticked for an alert that watches until you remove it ("Open-ended: this alert keeps watching until you remove it."). A new alert starts ticked, two months ahead. The time is on the chart's own clock, and the hint underneath names the time zone, the same one as the chart's time axis.
Alert name
The first box is the name. Leave it empty and the name is written for you from the alert, such as RSI crossing up 30; the box shows that name as its placeholder. The second box is an optional Message.
A message can carry values filled in at the moment the alert fires. Type a placeholder in double braces. The first five in the table are also shown as buttons under the box, and clicking one adds it to the end of the message.
| Placeholder | Fills in |
|---|---|
{{ticker}} | The instrument, as the chart names it. {{symbol}} works too |
{{exchange}} | The exchange it trades on |
{{interval}} | The chart's timeframe. {{timeframe}} works too |
{{price}} | The value that met the condition |
{{close}} | The fired bar's close |
{{open}} | The fired bar's open |
{{high}} | The fired bar's high |
{{low}} | The fired bar's low |
{{volume}} | The fired bar's volume, as a whole number |
{{time}} | The time of the bar the alert fired on |
{{timenow}} | The moment it was delivered |
For example, {{ticker}} crossed {{price}}, close {{close}} on {{interval}} arrives as a sentence you can act on from a notification. Prices are written with the instrument's own decimals. The two times are written like 2026-09-23 10:35, on your computer's clock rather than the chart's. A placeholder spelled wrong is left exactly as you typed it, and so is one the chart has no value for: a bar that carries no volume keeps {{volume}} rather than claiming zero.
Below the message, Active as soon as it is saved is ticked by default. Untick it to save the alert in the Stopped state.
When it fires
Four boxes choose how you are told, per alert:
| Box | Ticked for a new alert | What it needs |
|---|---|---|
| Sound | Yes | Nothing |
| Desktop notification | Yes | Your browser's permission, which the page asks for when you create or save an alert |
| Telegram | No | "Needs the bot running and your account linked" |
| No | "Needs a paired device" |
Sound and the desktop notification never leave your machine. Telegram and WhatsApp send the message out, and each must be set up on its own page in OpenAlgo first. See How a firing reaches you.
Saving
Click Create (or Save). If something is missing, the dialog says what in red and does not close:
| Message | What to do |
|---|---|
| Enter a price to watch. | Type a price in the value box |
| Enter a value to watch. | Type a value for the study plot |
| A channel needs both of its bounds. | Fill in Lower and Upper |
| A channel needs two different bounds. | Make Lower and Upper differ |
| Choose a study. This chart has none, or the one chosen has been removed. | Add a study to the chart, or pick another |
| Choose a plot from that study. | Pick a plot (see Study alerts for which entries are plots) |
| Drawings are still loading. Try again in a moment. | Wait a moment and click again |
| Draw something on the chart first, then alert on its level. | Draw first, then open the dialog |
| Choose which level of that drawing to watch. | Pick a level |
| Enter an expiry date and time, or switch the expiry off. | Complete the date and time, or untick Expires |
Study alerts, including on your own scripts
A study alert watches one plotted line against a value. It works the same on a built-in study and on a study you wrote in OpenScript, because a saved script sits on the chart like any other study.
The quickest way is to right-click the study's line and choose Create study alert. The alert is made at once, with the condition Crossing and the value the line had at the bar under the pointer, and otherwise the same settings as a right-click price alert. Open Edit on its row to change the condition or the value.
From the dialog, set What to watch to Study plot, then pick the Study and the Plot. For a study written in OpenScript the Plot list shows the keys the chart gives each plot(): p0 for the first plot() in the file, p1 for the second, and so on. The list also shows other columns the script produces, such as openscript:alert:0 for its first alert(). Those are not plots, and picking one stops at "Choose a plot from that study." Right-clicking the line is the surest way to get the plot you mean. The value is in the plot's own units: an RSI threshold of 70 is 70, and it is not rounded to the instrument's tick.
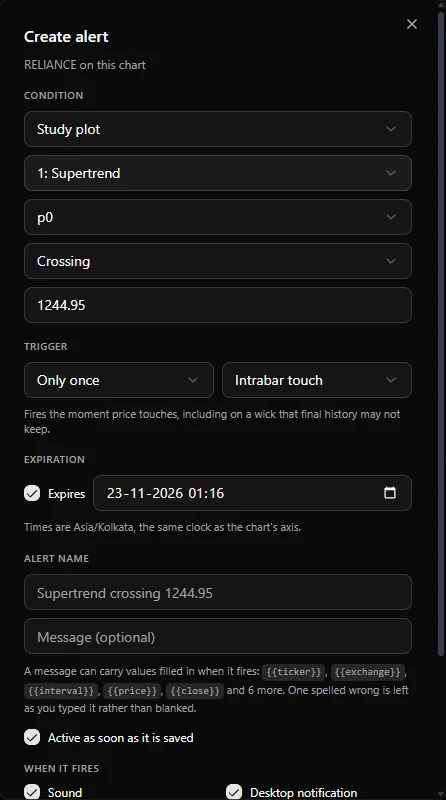
A study alert set to Intrabar touch reads the plot as it moves during the bar; set On bar close to judge only the value the bar closed with.
An alert on a study you later remove from the chart can no longer be checked. Its row says why, and it is dropped the next time the chart restores its alerts.
Drawing alerts
Right-click a drawing and choose Create drawing alert. When a drawing cannot carry an alert the entry is greyed out, and hovering it tells you why. From the dialog, choose Drawing level, then the Drawing and which Level of it to watch. There is no value to type: a trend line is at a price on every bar, and that price is the level.
Alerts from a script
A study that calls alert() needs no setup to be watched. Save it in the Scripts panel and put it on the chart with Apply to chart there, or from the Indicators dialog. Each alert() in it becomes a condition the chart checks as new bars arrive, starting from the next new bar.
When a script alert does fire on the chart:
- a toast shows the script's message, or its title when the message is absent on that bar;
- the alert sound plays, and a desktop notification appears if the /trading tab is hidden and the browser allows notifications;
- a row is added to the Log tab, with the title, the message and the symbol.
A few things set script alerts apart from the alerts you create on the chart:
- They are not in the Alerts tab, so they have no Stop, Edit or Delete. To silence them, remove the study from the chart, or take the
alert()out of the script and save it. - Delivery is fixed at Sound and Desktop notification. There is no box to tick for Telegram or WhatsApp.
- Nothing fires for history. Adding the study, or changing its settings, recalculates the past without sending anything. Only bars that arrive afterwards are checked.
- At most once per bar. The chart checks each
alert()once for each new bar, so thefrequencyvalues"once"and"everyUpdate"behave as"oncePerBar"here. See frequency. - The id names the alert. A repeat of the same
idreplaces its previous desktop notification rather than stacking another beside it. Give every alert a fixedidand atitle, as The id is a promise explains.
A strategy deployed from the Strategies panel runs on the OpenAlgo server rather than on the chart, so the limit above does not apply to it. It sends nothing while it replays history at the start; after that, each alert it raises is written as a line in that run's log, and it is not sent to this panel, the sound or any channel.
Alerts on a script condition
The dependable way to be told about something your script computes is to plot the condition as 1 or 0 and put a study alert on that plot. Set to On bar close, the study alert is judged on the closed bar, the same rule a script's alert() follows. It also has everything the dialog offers (a name, message placeholders, an expiry, repeat) and can go to Telegram or WhatsApp as well as the sound and the desktop notification.
version 1

study("Breakout flag", precision = 0, range = [0, 1])

upper = highest(high, 20)[1]
broke = crossUp(close, upper)

// 1 on the bar the close breaks the twenty bar high, 0 on every other bar.
plot(broke ? 1 : 0, "Breakout", aqua, style = "step")- Save the study and add it to the chart.
- Click Alerts on the chart toolbar to open Create alert.
- Set What to watch to Study plot, pick this study, and pick plot
p0. - Set Condition to Crossing up and type
0.5as the value, so the alert fires on the bar the flag steps from 0 to 1. - Set Evaluate to On bar close and Repeat to Every time.
- Tick the channels you want under When it fires, and click Create.
During warmup broke is absent, and an absent condition takes the second branch of ? :, so the plot reads 0 there rather than leaving a gap. To watch several conditions, give each its own plot() (they become p0, p1 and so on) and set one study alert per plot.
The Alerts panel
Click Alerts on the right-hand toolbar, between Objects and Scripts. The panel opens beside the chart, so you can keep it open while you watch the prices it is waiting for.
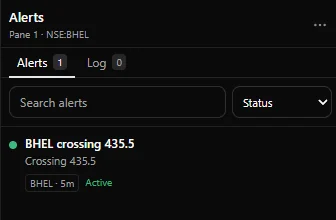
- The header reads Alerts, with the pane it describes underneath, such as
Pane 1 · NSE:SBIN. With several panes on screen it describes the pane you are working in. - The menu at the right of the header holds Start all, Stop all and Remove all alerts.
- Two tabs, Alerts and Log, each with a count.
- A search box under the tabs (Search alerts, or Search log) that matches the name, the message and the symbol.
- On the Alerts tab, a sort by Status, Name or Recently fired. On the Log tab, a Clear button in its place.
There is no New button. You create an alert where the price is, from the chart, and the panel shows what is already watching.
The Alerts tab
One row per alert on this pane. Each row shows:
- the alert's name, and the time it last fired (only the time when that was today, the date and time otherwise);
- its message, or when it has none, what it is waiting for, such as
Crossing up 812.45; - the symbol and timeframe it was made on, such as
SBIN · 5m; - its state.
| State | Means |
|---|---|
| Active | Watching |
| Fired | A Repeat Only once alert that has fired. It stays in the list, and its line is removed from the chart |
| Stopped | Paused by you, or saved with Active as soon as it is saved unticked |
| Expired | Its expiry time has passed. It stays in the list, and its line is removed from the chart |
Sorting by Status puts Active first, then Fired, Stopped and Expired.
A row can read Active and still not be checked at this moment. It then carries one more line saying why. The common ones:
| Line | Why | What to do |
|---|---|---|
| Switch to 5m to evaluate this alert | An alert is checked only on the timeframe it was made on. A price alert's line still shows on other timeframes | Switch the pane back to that timeframe |
| Instrument context differs | The pane now shows another symbol | Switch back to the symbol the alert was made on |
| Alerts are paused | The chart is in bar replay, a workspace is still loading, or the chart has no data | Leave replay or wait; alerts resume on their own |
Hover a row for its three actions: Stop (or Start on a stopped alert), Edit, which opens the Edit alert dialog, and Delete.
The Log tab
One row per firing, newest first, from every pane and every chart. Each row shows:
- the alert's name and a time: for a row added while the page is open, the time of the bar it fired on; for a row read back from the server, when it was recorded;
- the message, with its placeholders filled in;
- the symbol, and the price at which it fired when the firing carried one;
- on rows read back from the server, the channels that accepted the message:
sound,notification,telegram,whatsapp.
Rows added while the page is open show no channels. After a reload, a row with no channels listed is an alert that fired and reached nobody, which is a different thing from an alert that never fired.
The log is kept on the OpenAlgo server for 90 days, so firings survive a closed tab. When /trading opens, the page reads back the latest 200, and it holds up to 200 firings while it stays open, dropping the oldest first. Clear empties the log on the server as well; if the server does not agree, a toast says "The log could not be cleared. It will be back on the next reload."
How a firing reaches you
Every firing shows a toast on the page with the alert's message (or its name, when there is no message) and is written to the Log. The alert's When it fires boxes then decide the rest:
| Channel | What you get |
|---|---|
| Sound | Two short rising tones from the /trading tab |
| Desktop notification | Your operating system's notification, titled with the symbol and the alert's name, with the message as its text. Shown only while the /trading tab is hidden, because a visible page already has the toast. Clicking it brings the chart forward |
| Telegram | The symbol, the name and the message, sent through OpenAlgo's Telegram bot to your linked account |
| The same text, sent to your paired device |
The outward channels are tried together, and each is tried once. When one refuses, a toast says so in the server's own words, for example "The alert fired, but Telegram did not take it." followed by the reason, and it is not retried. The alert has already fired by then, and the Log row records which channels accepted it.
Managing alerts
| To | Do this |
|---|---|
| Change an alert | Edit on its row, then Save |
| Move a price alert | Drag its line on the chart |
| Pause and resume one | Stop and Start on its row |
| Pause or resume all | Stop all or Start all in the panel menu |
| Delete one | Delete on its row, or hover its line on the chart and press Delete or Backspace |
| Delete all on the pane | Remove all alerts in the panel menu |
| Silence a script's alerts | Remove the study from the chart |
| Clear the history | Clear on the Log tab |
Pressing Delete over the chart removes a drawing first when one is selected or under the pointer, and an alert's line only when nothing else claims the key.
Alerts belong to the chart pane they were made on and are saved with that chart in your browser, so they come back when you reopen /trading. A Repeat Only once alert that has fired comes back as Fired, not armed again, so it does not fire twice for the same price.
Related. Alerts from scripts, Realtime and confirmation, The editor, Plots, Sandbox and live, Troubleshooting