
Declarations
study() and strategy(), with every option, its type, its default and the values it accepts, plus the version line and the limits block that sit above and below them.
On this page
Every OpenScript file opens with the same set-up: the version line, one declaration, and an optional limits block. The declaration is either study(), for a script that computes and draws, or strategy(), for one that also places orders. Its options name the script, choose its pane and axis, and for a strategy set the money, the order size and the costs a backtest uses.
This page documents every option of both declarations with its type, its default and the values it accepts, and says what the /trading page does with each one in this release. Come here when you set up a new script, or when a backtest result depends on a default you did not choose.
version 1
strategy("NIFTY futures EMA cross", overlay = true, precision = 2,
         capital = 500000, currency = "INR",
         qty = 1, qtyType = "lots", product = "intraday",
         fillOn = "nextOpen", slippage = 2,
         commission = 20, commissionType = "perTrade",
         pyramiding = 1)

fast = ema(close, 9)
slow = ema(close, 21)

if crossUp(fast, slow)
    buy()
if crossDown(fast, slow) and not pos.isFlat
    close(qty = 1)          // see qtyType for why a lots strategy states the quantity

plot(fast, "Fast EMA", aqua)
plot(slow, "Slow EMA", orange)
The top of a file
| Line | Required | Rule |
|---|---|---|
| Comments | No | Comments and blank lines may come first |
version 1 | Recommended | The first line that is not blank and not a comment. Anything else before it is OS1021 |
study(...) or strategy(...) | Yes | Exactly one per file. None is OS2007, a second is OS2008. Write it directly under version |
limits(...) | No | At most once, on the line immediately after the declaration (OS3014) |
// Change over the last 100 bars.
version 1
study("Hundred bar change", precision = 2)
limits(history = 500)

plot(close - close[100], "Change over 100 bars", aqua)
The version line
Form: version 1.
Declares which language version the file was written for. Version 1 is the only one today.
The line is optional and worth writing every time. A file without it is compiled with the newest language version the compiler implements, and the compiler warns with OS8003. A file with it is read by the version 1 rules for good: a script that compiles under version 1 compiles under every later release and produces the same numbers. A later version may add keywords, functions, options and types; it never changes what an existing construct means.
Rules for every option
Both declarations are read once, before the first bar, because the legend, the axis and the settings dialog are built before any bar runs. So every option value must be fixed before bar 0:
| Written as | Accepted |
|---|---|
A literal: overlay = true, precision = 2 | Yes |
Arithmetic over literals: capital = 5 * 100000 | Yes |
A bare input(), or a name bound to one: precision = input(2, "Decimals") | Yes |
An expression computed from an input: precision = input(2, "Decimals") + 1 | No. In release 0.5.0 this is reported as OS6018, a message about a program that failed verification; the cause is the expression |
Anything that depends on bar data: overlay = close > open | No, OS3003 |
The first argument is the title and may be written positionally or as title = "...". Every other option is written by name. The compiler checks each one like a function argument:
| Mistake | Error |
|---|---|
| No title | OS3012 |
An option that does not exist, such as capital on a study | OS3002, listing the ones that do |
A value of the wrong type, such as overlay = 1 | OS3011 |
A string outside the accepted set, such as scale = "middle" | OS3008, listing the accepted values |
A whole number outside its range, such as precision = 11 or pyramiding = 0 | OS3004 |
A range that is not two numbers, lowest first | OS3016 |
A setting that a user changes in the settings dialog reaches a declaration option through its input. That is how a study lets a user choose its own decimals, or a strategy lets a user choose its capital, without editing the script.
version 1
strategy("Sized by a setting", overlay = true,
         capital = input(500000, "Starting capital", min = 10000),
         qty = input(75, "Units per trade", min = 1))

trend = sma(close, 50)
if crossUp(close, trend)
    buy()
if crossDown(close, trend)
    close()
study()
Form: study(title, short, overlay, precision, format, range, scale, group, onUnconfirmed)
Declares a script that computes and draws but places no orders. Calling an order function, or reading the pos namespace, in a study file is OS7001.
| Option | Type | Default | Accepted values |
|---|---|---|---|
title | string | Required | Any text. First positional argument |
short | string | The title | Any text |
overlay | bool | false | true or false |
precision | number | 4 | A whole number from 0 to 10 |
format | string | "price" | "price", "percent", "volume" |
range | array<number> | none | [min, max], with min below max |
scale | string | "right" | "right", "left", "none" |
group | string | "" | Any text |
onUnconfirmed | bool | false | true or false |
title
The script's name, shown in the chart legend and in the chart's indicator picker. It is the only required option. (The Scripts panel lists your scripts by file name, not by title.)
version 1
study("Distance from the 50 EMA", precision = 2)
plot(close - ema(close, 50), "Close minus EMA 50", aqua, style = "histogram")
level(0, "Zero", gray)
short
A shorter name, meant for a legend where space is tight. It is recorded with the compiled study for a host (the application that runs the script) that shows it. The /trading chart in this release shows the title in its legend and does not use short.
version 1
study("Volume weighted average price, reset daily", short = "VWAP", overlay = true)

newDay = bar.isFirst or not date.isSameDay(time, time[1])
plot(vwapAnchor(hlc3, newDay), "VWAP", orange)
overlay
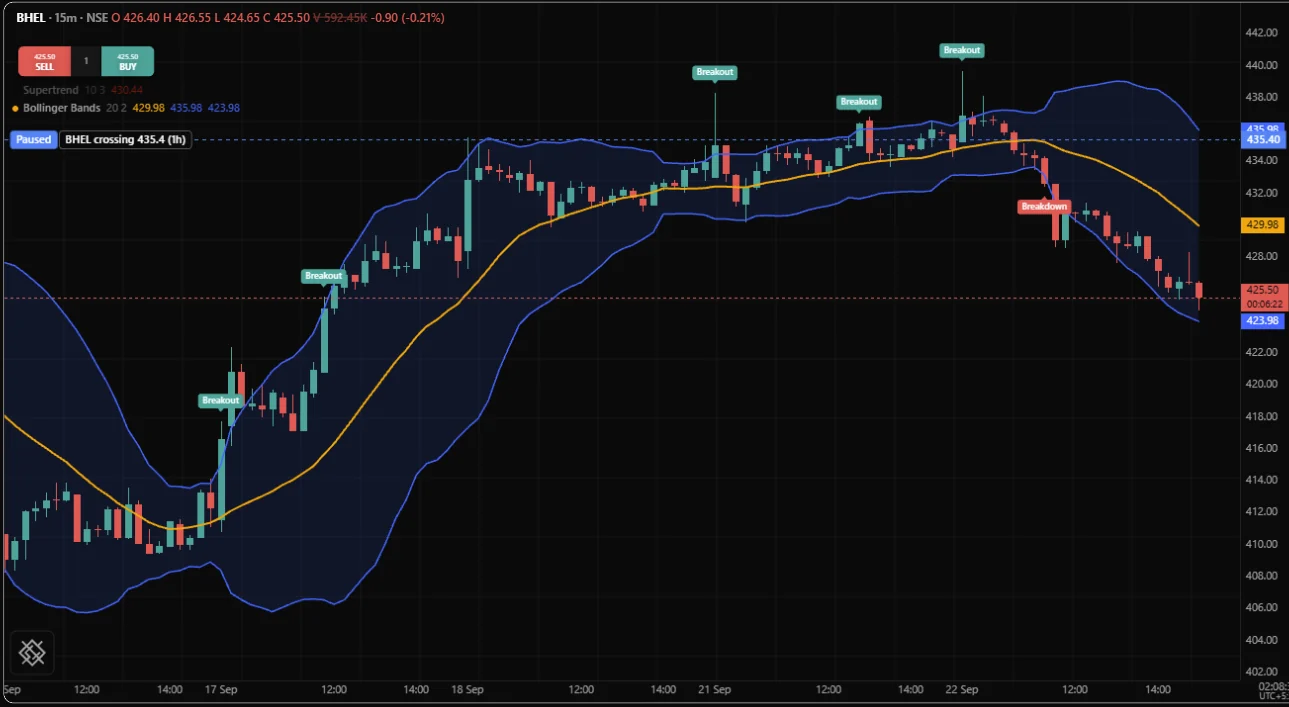
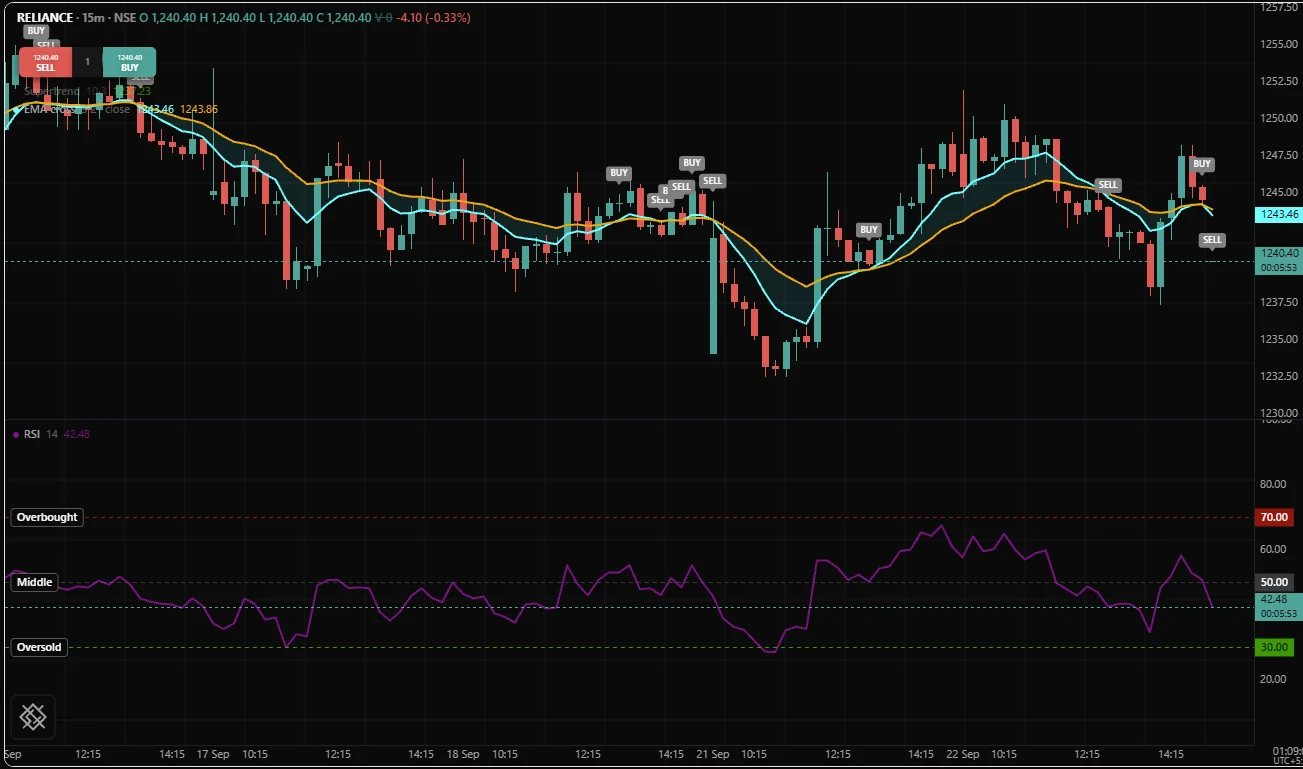
Chooses the pane. true draws on the price chart, over the candles, which suits moving averages, bands and levels. false, the default, gives the study its own pane below the price, which suits oscillators and volume.
With overlay = true, Bollinger Bands drawn over the candles of a BHEL 15 minute chart:
With overlay left at false, a relative strength index in its own pane below the price:
version 1
study("EMA 21", overlay = true)
plot(ema(close, 21), "EMA 21", orange)
precision
How many decimals the study's axis and legend show, a whole number from 0 to 10. Use 2 for rupee prices and oscillators, 0 for counts.
version 1
study("Up bars in 20", precision = 0)
plot(count(close > open, 20), "Up bars")
Remarks. precision and format apply to the plots drawn in the study's own pane. On an overlay study the plots sit on the price axis, which keeps the instrument's own formatting. A plot can set its own precision and format arguments, which take priority over the study's.
format
How the axis and the crosshair write values:
| Value | Writes |
|---|---|
"price" | A plain number with precision decimals |
"percent" | The value followed by a percent sign. It does not multiply by 100, so plot 150 to see 150% |
"volume" | An abbreviated quantity, such as 1.25K, 3.40M or 1.00B |
version 1
study("Relative volume", format = "percent", precision = 0)
plot(volume / sma(volume, 20) * 100, "Volume as a percent of its mean")
The example multiplies the ratio by 100 itself, so a bar with one and a half times its average volume reads 150%.
range
Fixes the study pane's scale to [min, max] instead of fitting it to the data. Use it for a bounded oscillator so the pane does not rescale as values move. The default, none, lets the pane fit its data.
version 1
study("RSI 14", precision = 2, range = [0, 100])
level(70, "Overbought", red)
level(30, "Oversold", lime)
plot(rsi(close, 14), "RSI", purple)
scale
Which price scale the study is measured against: "right", the default, "left", or "none" to draw on a scale of its own with no axis shown. On an overlay, "none" lets a series with very different values, such as volume, share the price pane without squashing the candles.
version 1
study("Volume on price", overlay = true, scale = "none")
plot(volume, "Volume", fade(gray, 50), style = "column")
group
A category for the chart's indicator picker, so related scripts sit together. When you leave it empty, the /trading chart lists the script under OpenScript.
version 1
study("High of the day", overlay = true, group = "Intraday")

newDay = bar.isFirst or not date.isSameDay(time, time[1])
var dayHigh = none
if newDay
    dayHigh = high
else if high > dayHigh
    dayHigh = high
plot(dayHigh, "High of the day so far", aqua, style = "step")
onUnconfirmed
Whether signals, alerts and orders may happen on a bar that is still forming. By default they may not: a signal(), an alert() or an order call on the moving newest bar is held until the bar closes, and dropped if its condition no longer holds by then. That keeps a chart of history identical to what it showed at the time.
Setting onUnconfirmed = true lets them happen within the bar. Your script then guards itself with bar.isConfirmed where it needs to, and the compiler warns with OS8002 on every higher timeframe read in the file, because that combination is where repainting (a past signal changing after the fact) comes from. See Realtime and confirmation.
version 1
study("Intrabar breakout", overlay = true, onUnconfirmed = true)

prevHigh = highest(high, 20)[1]
if close > prevHigh
    signal("BREAKING OUT")
plot(prevHigh, "20 bar high", aqua, style = "step")
strategy()
Form: strategy(title, ...every study option..., capital, currency, qty, qtyType, product, fillOn, slippage, commission, commissionType, pyramiding, closeOnSessionEnd)
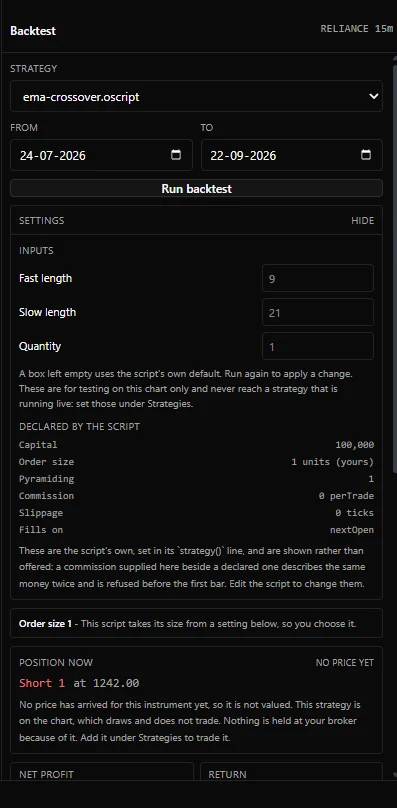
Declares a script that plots and places orders. It takes every study() option above, with the same defaults, plus the trading options below. One file both draws and trades, so the numbers you see and the numbers you trade are computed once. See Strategies overview.
| Option | Type | Default | Accepted values |
|---|---|---|---|
capital | number | 100000 | Starting equity for the backtest |
currency | string | "" | A label for money |
qty | number | 1 | The order size when an order names none |
qtyType | string | "units" | "units", "lots", "cash", "equityPercent" |
product | string | "intraday" | "intraday", "overnight" |
fillOn | string | "nextOpen" | "nextOpen", "close" |
slippage | number | 0 | Ticks of adverse slippage on every fill |
commission | number | 0 | The cost, in the unit commissionType names |
commissionType | string | "perTrade" | "perTrade", "perUnit", "percent" |
pyramiding | number | 1 | A whole number, 1 or more |
closeOnSessionEnd | bool | false | true or false |
capital
The equity the backtest starts with. The report measures returns and drawdowns against it. The backtest does not model margin, so capital does not limit the size of an order: a position worth more than the capital still fills.
version 1
strategy("Five lakh start", capital = 500000)

trend = sma(close, 20)
if crossUp(close, trend)
    buy()
if crossDown(close, trend)
    close()
currency
A label for money, such as "INR". It changes no number. It is recorded with the compiled strategy; the backtest report in this release labels money with the instrument's own currency, which the host supplies (the /trading Backtest panel uses INR), rather than with this option.
version 1
strategy("Rupee report", currency = "INR")

trend = ema(close, 50)
if crossUp(close, trend)
    buy()
if crossDown(close, trend)
    close()
qty
The order size used when an order call such as buy() does not name one. Its unit is set by qtyType.
version 1
strategy("Fifty shares a trade", qty = 50)

trend = ema(close, 20)
if crossUp(close, trend)
    buy()
if crossDown(close, trend)
    close()
qtyType
What the number in qty, and in an order's own qty, means.
| Value | qty = 1 means | In a backtest |
|---|---|---|
"units" | One unit: one share, or one unit of a contract. The default | Filled as written |
"lots" | One lot, of chart.lotSize units. The natural choice for NFO futures and options and for MCX | Converted to units with the instrument's lot size; refused when the host states no lot size |
"cash" | An amount of money, converted to a size at the fill price | Refused with OS6021 in this release |
"equityPercent" | A percentage of current equity | Refused with OS6021 in this release |
The backtest refuses cash and equity sizing because it keeps no running equity to size against, and it says so rather than filling the number as written.
version 1
strategy("Two lots a trade", qty = 2, qtyType = "lots")

trend = ema(close, 20)
if crossUp(close, trend)
    buy()
if crossDown(close, trend) and not pos.isFlat
    close(qty = 2)
product
Whether positions are meant to close within the session, "intraday", or may be carried to another session, "overnight". It is recorded on every order the strategy sends. A backtest fills the same way under either value and does not square off an intraday position for you; see closeOnSessionEnd for that.
version 1
strategy("Positional swing", product = "overnight", qty = 50)

fast = ema(close, 20)
slow = ema(close, 50)
if crossUp(fast, slow)
    buy()
if crossDown(fast, slow)
    close()
fillOn
Where an order decided on a bar is filled. "nextOpen", the default, fills at the next bar's open, which is what the real market allows: a decision made from a bar's close cannot also be filled at that same close. "close" fills at the deciding bar's close, which is optimistic, so choose it only when you know your execution can do that.
version 1
strategy("Honest fills", fillOn = "nextOpen")

trend = ema(close, 20)
if crossUp(close, trend)
    buy()
if crossDown(close, trend)
    close()
slippage
Ticks of adverse slippage applied to every market and stop fill: a buy fills higher and a sell lower by this many ticks of the instrument's tick size. On a contract whose tick is 0.05, slippage = 2 moves each fill by 0.10 against you. A limit order is never slipped. Set it before you read any result.
version 1
strategy("Two ticks of slippage", slippage = 2)

trend = ema(close, 20)
if crossUp(close, trend)
    buy()
if crossDown(close, trend)
    close()
commission
The cost charged on each fill, in the unit that commissionType names. The default is 0, which makes every trade free and flatters every result.
version 1
strategy("Twenty rupees an order", commission = 20, commissionType = "perTrade")

trend = ema(close, 20)
if crossUp(close, trend)
    buy()
if crossDown(close, trend)
    close()
commissionType
What the commission number counts.
| Value | commission is | A round trip of 10 units, in at 102 and out at 104, costs |
|---|---|---|
"perTrade" | A flat amount per order. The default | commission = 20 costs 40: 20 on the entry, 20 on the exit |
"perUnit" | An amount per unit traded | commission = 2 costs 40: 2 on each of 10 units, twice |
"percent" | A percentage of the traded value: 0.03 means 0.03 percent | commission = 0.03 costs 0.62: 0.03 percent of 1,020 plus 1,040 |
version 1
strategy("Percent of turnover", commission = 0.03, commissionType = "percent")

trend = ema(close, 20)
if crossUp(close, trend)
    buy()
if crossDown(close, trend)
    close()
pyramiding
The most entries allowed in one direction at once. The default, 1, means one entry. An entry beyond the limit is not quietly skipped: the backtest stops at that bar with OS7008. So a strategy that can signal again while it is already in a position checks the position before it enters, as the example does with pos.size.
version 1
strategy("Add on strength", pyramiding = 3)

breakout = close > highest(high, 20)[1]
if breakout and pos.size < 3
    buy()
if close < lowest(low, 10)[1]
    close()
closeOnSessionEnd
Asks for any open position to be flattened at the session's close, for an intraday strategy that must not carry a position overnight. It is recorded in the compiled strategy, but in release 0.5.0 the backtest does not act on it, so close explicitly before the session ends.
Two things decide how you do that:
- The exact test for the last bar is
session.isLastBar, which needs the host to state the instrument's session hours. The /trading chart and Backtest panel do not state them in this release, so there it isnone. - With the default
fillOn = "nextOpen", an order decided on the session's last bar fills at the next bar's open, which is the next session's first bar, so the position is carried overnight anyway.
A window you name avoids both. The example starts closing at 15:15, so the exit fills at the next bar's open while the session is still trading, and it names the zone so the window is read in Indian time even where the host states no timezone.
version 1
strategy("Flat by the close", overlay = true, product = "intraday", closeOnSessionEnd = true)

lateSession = session.isIn("1515-1530", "Asia/Kolkata")
fast = ema(close, 9)
slow = ema(close, 21)

if crossUp(fast, slow) and not lateSession
    buy()
if crossDown(fast, slow) or lateSession
    close()
The limits block
Form: limits(loops = n, history = n), on the line immediately after the declaration.
Sets the run's budgets. Both options are optional, and the block itself is optional.
| Option | Sets | Default |
|---|---|---|
loops | Loop iterations allowed per bar, summed across every loop that runs on that bar | 2,000,000 |
history | Bars of each series kept for [n] to read | Every bar of the data |
The rules:
- It appears at most once, directly under
study(...)orstrategy(...). Anywhere else isOS3014. - Its values are literal numbers, not inputs or expressions (
OS3015), because the budget is settled before the program is loaded and a reader should see it in the file. - An option it does not have, such as
depth, isOS3002. - Running past the loop budget stops the script with
OS5001rather than breaking out of the loop and plotting a plausible wrong number. - Reading further back than
historykeeps isOS4002, which names the depth that was kept. - A host that will not run the budget you ask for says so with
OS5003instead of quietly lowering it. - Arrays stay capped at 1,000,000 elements whatever
limitssays.
Raise loops only when a script's loops genuinely run past two million iterations on one bar. Set history when you know how far back the script reads and want memory to stay bounded over a long run.
version 1
study("Two hundred bar scan")
limits(history = 500)

hits = 0
for i = 1 to 200
    if close[i] > close
        hits += 1
plot(hits, "Of the last 200 bars, closes above this one")
See Limits for the budgets a host enforces and how to stay inside them.
Related: Keywords, Types, Script structure, Inputs, Costs and fills, Position and sizing.