
Lines and boxes
Draw trendlines, zones and paths with draw.line, draw.box and draw.polyline, anchor them so they stay put, move them as bars arrive, and delete them on a rule.
On this page
A plot is one value per bar. Some things you want on a chart are not: a trendline between two swing highs, a supply zone that holds until price closes through it, the opening range of today's session. For those, OpenScript has drawing objects: shapes your script creates on one bar, keeps across many, moves as bars arrive and deletes when they stop being useful.
This page covers the three shape constructors, draw.line(), draw.box()
and draw.polyline(), and the discipline that keeps a drawing study fast on a
long chart: anchor on time, create once and move, and decide how every object
dies before you write the line that creates it. Labels are drawing objects too;
what goes in them is on Labels and shapes.
Why an object and not a plot
| You want | Use | Because |
|---|---|---|
| A value the chart has on every bar | plot() | The chart already knows where it goes: bar by bar, at that bar's value |
| A line between two moments that are not adjacent | draw.line() | Two anchors, and nothing to say about the bars between them |
| A rectangle over a price band for a stretch of time | draw.box() | A start, an end, a top and a bottom, none of which is per bar |
| A path through many points | draw.polyline() | One shape, many anchors, optionally closed and filled |
| A fact about a bar with no price attached | background() or barColor() | See Bar colouring and backgrounds |
The test that settles it: if you can write the thing down as a number for every bar, plot it. A trailing stop is a plot. The line joining the two swing highs of a divergence (price making a higher high while an oscillator such as RSI makes a lower one) is not, because on the bars between them there is no value to state.
The constructors
All drawing calls live in the draw namespace and may appear anywhere a
statement may: inside an if, a loop or a function. They are not part of the
study's fixed shape, so the top-level rule for plot() and table() does
not apply to them.
| Call | Draws | Key arguments |
|---|---|---|
draw.line(t1, p1, t2, p2) | A straight line between two points | color (default gray), width, style ("solid", "dashed" or "dotted"), extendLeft, extendRight |
draw.box(t1, p1, t2, p2) | A rectangle between two corners | color for the border (default none, no border), fillColor (default none, no fill), opacity (default 0.12), width, text, textColor, tooltip |
draw.polyline(times, prices) | A path through every point | color (default gray), width, closed, fillColor, opacity (default 0.12) |
draw.label(t, p, text) | A plate of text at a point | See Labels and shapes |
Each returns an object of type line, box, polyline or label. An object
is an ordinary value: you can name it inside a block, keep it in a var, hold a
set of them in an array, pass one to a function and compare one with none.
The drawing reference lists every argument with its
type and default.
Two details of boxes are easy to miss:
opacitydims the fill colour you give it. The fill is drawn atopacitytimes the colour's own strength.fillColor = redwith the default 0.12 is a faint red.fillColor = fade(red, 85)is already 85 percent transparent, and dimmed again to 0.12 it is all but invisible. Pass a plain colour and set the strength withopacity.- A box's
textsits on a plate at the centre of the box, in the border colour, written intextColor(white by default).
draw.polyline takes two arrays of the same length, one of times and one of
prices, read index by index. The path is copied when you call it: pushing to
those arrays afterwards does not redraw the shape. draw.setPoints() is how a
path changes. A point whose time or price is absent leaves a gap in the path,
and a path with a gap is drawn open and unfilled, whatever closed says.
An anchor is a time and a price
Every anchor is a timestamp in milliseconds (UTC) and a price on the pane's scale. Never a bar index, never a pixel, never an offset from the right edge.
The reason is how charts load data. bar.index counts bars from the start of
the data the chart was given, so loading an older year of history renumbers
every bar; a line anchored at index 12,400 would jump somewhere else entirely.
time does not move: the bar that opened at 09:15 on a given day opened then
however much history sits to its left.
The price side follows the pane the study draws in. An overlay study anchors on the instrument's price scale. A study with its own pane anchors on that pane's scale, so a divergence line between two RSI readings is anchored at, say, 71.4 and 64.8.
Pivots are where anchoring usually goes wrong, so here it is done right:
version 1
study("Swing line", overlay = true, precision = 2)

leftBars  = input(5, "Pivot left bars", min = 1, max = 50)
rightBars = input(5, "Pivot right bars", min = 1, max = 50)

pivot = pivotHigh(high, leftBars, rightBars)

var lastTime  = none
var lastPrice = none

if not isNone(pivot)
    // A pivot is reported rightBars bars after the bar it formed on,
    // so the anchor is that older bar's time.
    pivotTime = time[rightBars]

    if not isNone(lastTime)
        draw.line(lastTime, lastPrice, pivotTime, pivot, color = orange, width = 2)

    lastTime  = pivotTime
    lastPrice = pivot
That script is right about anchoring and wrong about lifecycle: it creates one line per pivot and never removes any. Decide the lifecycle first fixes it.
Create once, then move
A handle held in a var refers to the same object on the next bar. That is the
whole mechanism behind a well-behaved drawing study: create once, then move
and restyle the same object for as long as it is needed.
| Call | Takes | Changes |
|---|---|---|
draw.setFrom() | A line or a box | The first anchor |
draw.setTo() | A line or a box | The second anchor |
draw.setBounds() | A line or a box | Both anchors in one call |
draw.setAt() | A label | Its anchor |
draw.setPoints() | A polyline | The whole path |
draw.setText() | A label or a box | The caption |
draw.setColor() | Any object | The line, border or plate colour |
draw.setTextColor() | A label or a box | The text colour |
draw.setFillColor() | A box or a polyline | The fill |
draw.setWidth() | A line, a box or a polyline | The line thickness |
draw.setStyle() | A line | "solid", "dashed" or "dotted" |
draw.setExtend() | A line | Whether it continues to the pane edge, left and right |
draw.setTooltip() | A label or a box | The text shown on hover |
draw.delete() | Any object | Removes it |
draw.deleteAll() | Nothing | Removes every object this script created |
draw.count() | Nothing | Returns how many objects this script holds |
Each setter names the kinds of object it takes, because only those kinds have the property. Passing another kind is refused before the first bar with OS3011:
zone = draw.box(time[10], high, time, low)
draw.setStyle(zone, "dashed")
Here is the pattern in full. Two dashed lines mark the previous session's high and low, and there are exactly two of them on a chart of any length:
version 1
study("Previous session high and low", overlay = true, precision = 2)

// The first bar of a trading day: the first bar on the chart, or a bar on a
// different IST date from the bar before it.
newDay = isNone(time[1]) or not date.isSameDay(time, time[1], "Asia/Kolkata")

var dayStart    = none
var runningHigh = none
var runningLow  = none
var highLine    = none
var lowLine     = none

if newDay
    // The day that just ended is complete, so its high and low are final.
    // Each line runs across that day and extends right, across today.
    if not isNone(runningHigh)
        if isNone(highLine)
            // Created when the second day on the chart begins.
            highLine = draw.line(dayStart, runningHigh, time, runningHigh,
                                 color = red, style = "dashed", extendRight = true)
            lowLine  = draw.line(dayStart, runningLow, time, runningLow,
                                 color = lime, style = "dashed", extendRight = true)
        else
            // Moved as each later day begins, never redrawn.
            draw.setBounds(highLine, dayStart, runningHigh, time, runningHigh)
            draw.setBounds(lowLine, dayStart, runningLow, time, runningLow)

    dayStart    = time
    runningHigh = high
    runningLow  = low
else
    runningHigh = max(runningHigh, high)
    runningLow  = min(runningLow, low)
The isNone(highLine) test does the work of a constructor: the first time
through it creates, every time after it moves. A var that starts as none and
a test for absence is the idiom for "I have not made this yet" throughout the
language.
The lines are moved once a day, on its first bar, not on every bar, because
they have nothing to follow in between: extendRight carries them across the day on its own. The
oldest day on the chart may have started before the first loaded bar, so the
first pair of lines can describe only part of a day; every pair after it is
complete.
Extending to the right
The chart has empty space to the right of the newest bar. Lines and boxes reach into it differently.
A line extends. extendRight = true continues the line past its second
anchor to the edge of the pane, and keeps doing so as the chart scrolls.
extendLeft = true does the same to the left, and draw.setExtend() changes
either later. An extended line needs no maintenance: its anchors fix its slope
and the chart draws the rest.
Give an extended line two different times. Its slope comes from the gap between the anchors, and a line whose two anchors share a time is vertical, so extending it draws a vertical line through the whole pane. That is why the study above anchors each line at the start of the day it describes rather than at the bar that creates it.
A box does not. A box has no extend argument, so a box that should reach the
current bar has its right edge moved there on each bar with draw.setTo().
That is one call per bar against one object, which is cheap.
Avoid projecting an edge a fixed number of bars past the newest bar. It looks
easy: chart.intervalMinutes gives the length of one bar, and time - time[1]
seems to as well. Both are wrong exactly where it matters. The bar after 15:25
on a 5 minute NSE chart opens at 09:15 the next trading day, not at 15:30, and
time - time[1] is five minutes inside a session but the whole overnight gap
across one. The first bars of a session are where a projected edge is looked at
hardest. So set a box's right edge to time, this bar's own opening instant,
and use a line with extendRight for anything that must reach further.
This study draws a box around the opening range of each session, the high and low of the first minutes after the 09:15 open, and keeps the last few sessions:
version 1
study("Opening range box", overlay = true, precision = 2)

rangeMinutes = input(15, "Opening range, in minutes", min = 1, max = 240)
keepSessions = input(5, "Sessions to keep", min = 1, max = 60)

// The first bar of a trading day, by its IST date.
newDay = isNone(time[1]) or not date.isSameDay(time, time[1], "Asia/Kolkata")

var openTime  = none
var rangeHigh = none
var rangeLow  = none
var zone      = none
var zones     = []

if newDay
    openTime  = time
    rangeHigh = high
    rangeLow  = low
    // Let go of the previous session's box; the zones list still holds it.
    zone      = none

// Milliseconds since the day's first bar opened.
elapsed = isNone(openTime) ? none : time - openTime
forming = not isNone(elapsed) and elapsed < rangeMinutes * 60000

if forming
    rangeHigh = max(rangeHigh, high)
    rangeLow  = min(rangeLow, low)

    if isNone(zone)
        zone = draw.box(openTime, rangeHigh, time, rangeLow,
                        color = aqua, fillColor = aqua, opacity = 0.08)
        push(zones, zone)
        if size(zones) > keepSessions
            // shift removes the oldest handle and returns it for deleting.
            draw.delete(shift(zones))
    else
        draw.setBounds(zone, openTime, rangeHigh, time, rangeLow)

else if not isNone(zone)
    // The range is complete: only the right edge follows the session.
    draw.setTo(zone, time, rangeLow)
While the range is forming, draw.setBounds() moves both corners, because the
high and the low can still change. Once it is complete only the right edge
moves. The oldest day on the chart may start after 09:15, and then its box
covers the first minutes the chart holds rather than the true opening range.
Decide the lifecycle first
An object stays on the chart until your script deletes it. Nothing is ever removed to make room. A script may hold at most 10,000 objects at once, and one that tries to create another stops with OS5010 rather than silently dropping old ones. Limits lists every limit the engine enforces.
Holding objects comes with one obligation: decide how each object dies before you write the line that creates it. Every correct drawing study uses one of three shapes:
| Shape | Looks like | Objects held | Use it when |
|---|---|---|---|
| One object, moved forever | Create under isNone(handle), then draw.set... | One per thing drawn | The thing always exists: a level, a channel, today's range |
| A capped list | push on create, draw.delete(shift(list)) over the cap | At most the cap | One object per event: zones, divergences, breakouts |
| Create and forget | A bare draw.line(...) on an event | One per event, forever | Only when the number of events is known to be small |
The swing line study above is the third shape. On a chart with two thousand pivots it leaves two thousand lines, each of which the chart must hold and redraw whenever you pan. Turning it into the second shape takes one input, one list and three lines:
version 1
study("Swing lines, capped", overlay = true, precision = 2)

leftBars  = input(5, "Pivot left bars", min = 1, max = 50)
rightBars = input(5, "Pivot right bars", min = 1, max = 50)
keep      = input(20, "Lines to keep", min = 1, max = 500)

pivot = pivotHigh(high, leftBars, rightBars)

var lastTime  = none
var lastPrice = none
var lines     = []

if not isNone(pivot)
    pivotTime = time[rightBars]

    if not isNone(lastTime)
        push(lines, draw.line(lastTime, lastPrice, pivotTime, pivot,
                              color = orange, width = 2))
        // Deleted on the bar that goes over the cap, so no bar ends
        // holding more than keep lines.
        if size(lines) > keep
            draw.delete(shift(lines))

    lastTime  = pivotTime
    lastPrice = pivot
Arrays of objects
var lines = [] has no type written on it. The first push() fixes the
element type, which is how an empty array literal learns what it holds. You can
also write the type yourself, which reads well when the first push is far away:
var zones: array<box> = []

if bar.isLast and size(zones) == 0
    push(zones, draw.box(time[20], high[20], time, low, color = teal))
An empty literal with neither an annotation nor a first use is OS2015:
var zones = []Deleting an object does not remove it from an array that holds it, so delete the
object and then remove the element. draw.delete(shift(list)) does both in one
line, because shift() returns the element it removes. Collections
covers arrays in full.
Two more rules fall out of the same thinking:
- Delete from a list downwards. A loop that walks a list upwards and removes
elements as it goes skips the element after every removal, because removal
renumbers everything above it.
for i = size(list) - 1 to 0 step -1makes that impossible. draw.deleteAll()is a reset, not a maintenance plan. Deleting and redrawing everything on every bar is correct and wasteful: it rebuilds the whole drawing layer fifty thousand times to show the state of the last bar. It earns its place in a study that draws a small fixed set of objects for the current state only, onbar.isLast.
draw.count() is the health check. A study that draws should be able to say
how many objects it holds, and a count that climbs without limit on a long chart
is the bug this section exists to prevent. print(draw.count()) on the last bar
tells you; see Debugging.
Deleted objects and stale handles
A handle held in a var outlives the object it names. Deleting the object does
not blank the handle, and a setter called on a deleted object stops the script
with OS4005, naming the bar the object was
deleted on, rather than doing nothing.
That is on purpose: a script changing an object it already deleted has lost
track of its own state, and failing at the first stale call names the bar where
it happened. A setter given none, on the other hand, does nothing. So the fix
is one line: set the handle to none beside every delete, and test
isNone() before every change.
var zone       = none
var zoneTop    = none
var zoneBottom = none

pivot = pivotHigh(high, 5, 5)
band  = atr(14)

// A zone below each swing high, while none is standing.
if not isNone(pivot) and not isNone(band) and isNone(zone)
    zoneTop    = pivot
    zoneBottom = pivot - band
    zone       = draw.box(time[5], zoneTop, time, zoneBottom, color = red)

// A close above the zone breaks it.
if not isNone(zone) and close > zoneTop
    draw.delete(zone)
    zone = none    // without this line the setter below raises OS4005

if not isNone(zone)
    draw.setTo(zone, time, zoneBottom)
Objects on the forming bar
The newest bar of a chart receiving updates runs again on every update. Drawing
objects follow the same rollback rule as var values: before each run of the
forming bar, the set of objects is restored to what it was at the end of the
previous bar. A script that creates a line on a condition does not gain one line
per update, and a chart left open all day shows the same objects as the same
study loaded afresh over the same bars.
The one thing to remember: hold object handles in var, never in live var.
A live var deliberately keeps its value through the rollback, but the object
does not. Suppose the line below is first created on a forming bar. On the next
update the rollback removes the line, while guide still names it. isNone(guide)
is now false, so the line is never created again, and a setter given a handle to
an object that no longer exists does nothing. The line vanishes after one update
and never comes back, with no error to say why. The compiler flags every
live var with OS8011:
live var guide = none

if isNone(guide)
    guide = draw.line(time[1], close[1], time, close)
else
    draw.setTo(guide, time, close)
See Realtime and confirmation and Persistence.
Objects are written, not read
There is no call that asks an object where it is. You can create an object, move it, restyle it and delete it, but not read its top, its bottom or its anchors back.
So a script that needs to reason later about what it drew keeps the numbers itself, in arrays parallel to the handles. That is not a workaround: the numbers a zone was built from are the script's own data, and keeping them is what lets the script decide, four hundred bars later, whether price has closed through the zone. The drawing is output; the numbers are state.
This study draws supply and demand zones where price turned. A supply zone is a price band where sellers pushed price down, a demand zone one where buyers pushed it up. The study extends each zone to the current bar while it holds, and deletes it when price closes through it or it grows too old:
version 1
study("Supply and demand zones", overlay = true, precision = 2)

leftBars  = input(5, "Pivot left bars", min = 1, max = 50)
rightBars = input(5, "Pivot right bars", min = 1, max = 50)
maxAge    = input(200, "Delete a zone after this many bars", min = 10, max = 5000)
maxZones  = input(12, "Most zones to hold", min = 1, max = 100)

// One array of objects, and four arrays of the numbers behind them.
var zones      = []
var zoneTop    = []
var zoneBottom = []
var zoneSide   = []
var zoneBar    = []

// Walked downwards, so removing element i never skips one.
for i = size(zones) - 1 to 0 step -1
    top    = element(zoneTop, i)
    bottom = element(zoneBottom, i)
    side   = element(zoneSide, i)
    age    = bar.index - element(zoneBar, i)

    // Closing through a zone breaks it; a wick into it is the zone working.
    broken = side > 0 ? close > top : close < bottom

    if broken or age > maxAge
        draw.delete(element(zones, i))
        remove(zones, i)
        remove(zoneTop, i)
        remove(zoneBottom, i)
        remove(zoneSide, i)
        remove(zoneBar, i)
        continue

    draw.setTo(element(zones, i), time, bottom)
    draw.setTooltip(element(zones, i), (side > 0 ? "Supply" : "Demand") +
                    ", " + text(age, 0) + " bars old")

pivotUp   = pivotHigh(high, leftBars, rightBars)
pivotDown = pivotLow(low, leftBars, rightBars)

// A supply zone runs from the turning bar's high down to the top of its body,
// the wick where price was turned away. A demand zone mirrors it below.
if not isNone(pivotUp) and size(zones) < maxZones
    zoneHigh = high[rightBars]
    zoneLow  = max(open[rightBars], close[rightBars])
    push(zones, draw.box(time[rightBars], zoneHigh, time, zoneLow,
                         color = red, fillColor = red, text = "Supply"))
    push(zoneTop, zoneHigh)
    push(zoneBottom, zoneLow)
    push(zoneSide, 1)
    push(zoneBar, bar.index - rightBars)

if not isNone(pivotDown) and size(zones) < maxZones
    zoneHigh = min(open[rightBars], close[rightBars])
    zoneLow  = low[rightBars]
    push(zones, draw.box(time[rightBars], zoneHigh, time, zoneLow,
                         color = lime, fillColor = lime, text = "Demand"))
    push(zoneTop, zoneHigh)
    push(zoneBottom, zoneLow)
    push(zoneSide, -1)
    push(zoneBar, bar.index - rightBars)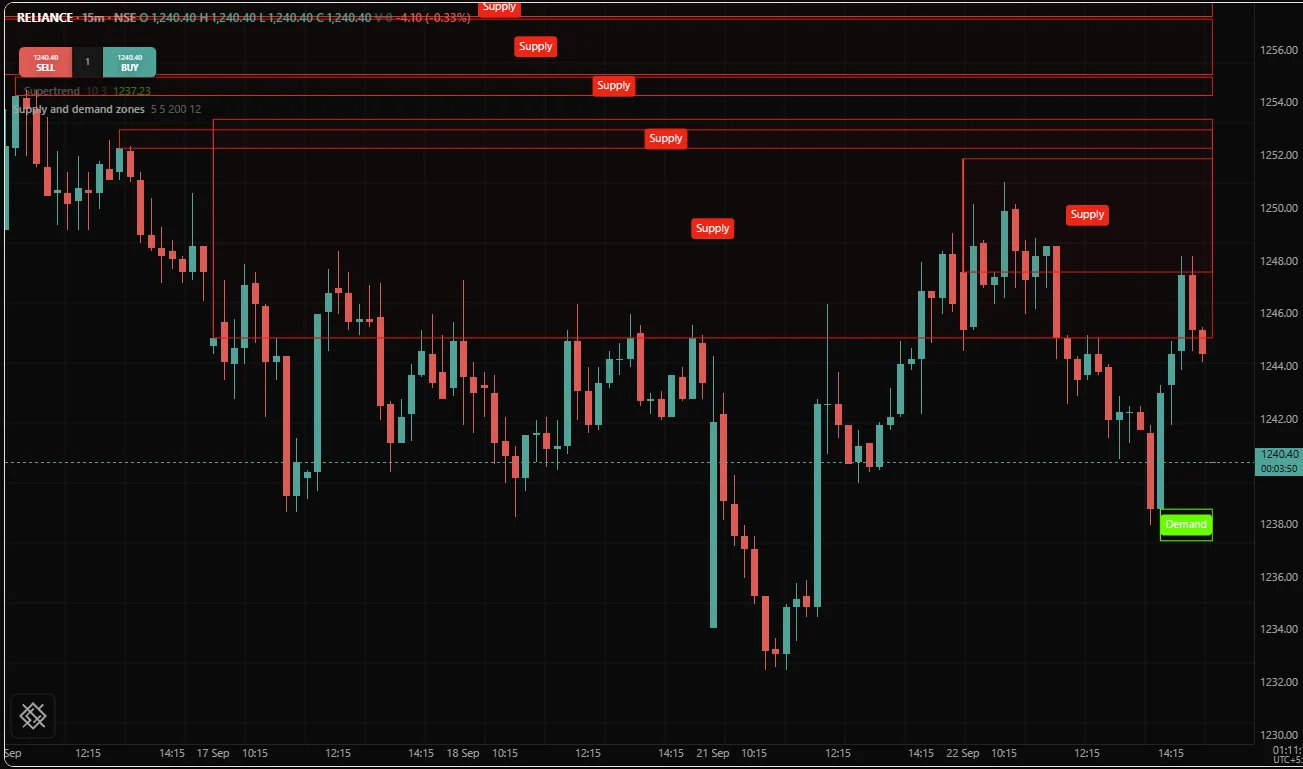
Three details make it hold up on a long chart. Subtracting two bar indexes is
safe inside one run, which is why the age is measured with bar.index while
every anchor uses time. Each box's right edge moves to time, never past it.
And every zone has a way to die: broken, too old, or never created once the list
is full.
The study declares no plot at all. Nothing it produces is one value per bar.
Paths with draw.polyline
A polyline is the shape for a path with more than two points, which would
otherwise be one draw.line per segment. This study joins the last dozen swing
points into one path and replaces the path as each new swing forms:
version 1
study("Swing path", overlay = true, precision = 2)

leftBars  = input(5, "Pivot left bars", min = 1, max = 50)
rightBars = input(5, "Pivot right bars", min = 1, max = 50)
points    = input(12, "Points in the path", min = 3, max = 100)

pivotUp   = pivotHigh(high, leftBars, rightBars)
pivotDown = pivotLow(low, leftBars, rightBars)

var pathTimes  = []
var pathPrices = []
var path       = none

swing = isNone(pivotUp) ? pivotDown : pivotUp

if not isNone(swing)
    push(pathTimes, time[rightBars])
    push(pathPrices, swing)

    // Trim both arrays together, so they stay the same length.
    if size(pathTimes) > points
        shift(pathTimes)
        shift(pathPrices)

    // One object whose path is replaced, not one line per segment.
    if isNone(path)
        path = draw.polyline(pathTimes, pathPrices, color = purple, width = 2)
    else
        draw.setPoints(path, pathTimes, pathPrices)
Pass closed = true with a fillColor and the same call draws a filled shape,
which is how a script shades a triangle or a wedge:
if bar.isLast
    draw.polyline([time[30], time[15], time], [low[30], high[15], low],
                  color = teal, closed = true, fillColor = teal, opacity = 0.1)
Common mistakes
| Symptom | Cause | Fix |
|---|---|---|
| Lines move to the wrong place when older history loads | Anchored on bar.index | Anchor on time, which does not move |
| The study gets slower the longer the chart is open, or stops with OS5010 | Create and forget | Cap the list, or keep one object and move it |
A line marks a bar exactly rightBars too late | Anchored at time on the bar that reported the pivot | Anchor at time[rightBars] |
| OS4005 long after a delete | The handle was not cleared when the object was deleted | Set the handle to none beside the draw.delete |
| OS3011 on a setter | The setter does not take that kind of object | Check the setter table: only lines have a style, only labels and boxes have text |
| OS2015 on an empty array | Nothing tells the compiler what the array holds | Push to it, or write var zones: array<box> = [] |
| A box's right edge lands differently on each timeframe | A guessed bar length | Move the right edge to time, or use a line with extendRight |
| A drawing vanishes on the forming bar and never comes back | A handle kept in a live var | Use var, so the handle rolls back with the object |
| The box hides the candles | A fill that is too strong | Lower opacity |
| A box's fill cannot be seen | A faded fill colour dimmed again by opacity | Pass a plain colour and set the strength with opacity |
| A vertical line crosses the whole pane | An extended line whose two anchors share a time | Anchor the line at two different times |
| A study that resets each session draws nothing on the /trading chart | It resets on session.isFirstBar, which has no value there | Test for a new IST date, as the examples here do |
Related. Labels and shapes for text
plates and markers, Tables for numbers pinned to a
corner, Bar colouring and backgrounds
for a zone that has no price extent, Colors for line,
border and fill colours, and the drawing reference
for every draw call.