
Troubleshooting
The problems people hit most often with OpenScript, grouped by what you see on the chart, each with its cause and its fix.
On this page
This page takes the symptom you are looking at, such as a blank pane, a line that stops short, a signal that fires on every bar or a strategy that stops trading, and gives you the cause and the fix. It covers OpenScript studies and strategies in the /trading page (OpenScript is also called OpenAlgo Script).
Entries are grouped by where the symptom shows up, not by which part of the language is involved, because you know what you are looking at and not yet what caused it. Each has a Cause and a Fix.
Two habits first
Two habits solve more problems than this whole page.
Plot the thing you are unsure about. A bool becomes cond ? 1 : 0, and a suspicion becomes a line you can look at. A flat zero means false; a gap means absent, and the two have completely different causes.
fast = ema(close, 9)
slow = ema(close, 21)
up = fast > slow

// A gap on the left is warmup. A flat zero is a condition that is false.
plot(isNone(up) ? none : (up ? 1 : 0), "debug: up", fuchsia, style = "step")
Read the warnings. OS8xxx warnings stop nothing, and each describes a shape that is legal and almost never what the author meant. Every save in the Scripts panel compiles the script, and the console under the editor lists the warnings with the errors.
Nothing is drawn
My study draws nothing at all
Cause. Usually one of three things: there is no plot() in the file, the value passed to plot is absent on every bar, or the study is in its own pane and you are looking at the price pane. When the compiler can see that a plotted value is absent on every bar, it raises warning OS8009, "this plot can never draw", so check the warnings first.
Fix. Confirm the file has a plot. Then plot the raw input to your calculation rather than the result, and work forward until the line disappears. If the study belongs over the candles, say so in the declaration: study("Name", overlay = true). See Plots.
My line starts late on the left
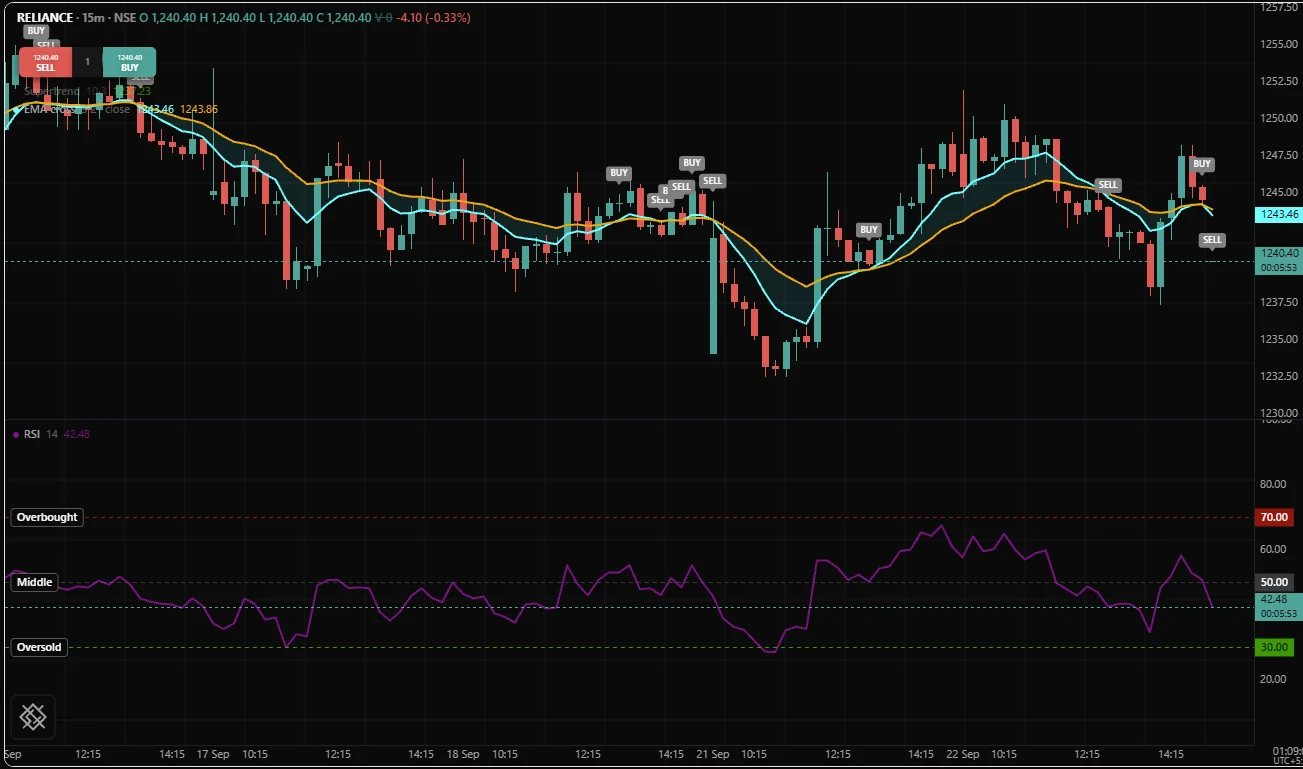
Cause. This is warmup, and it is working. A function that needs k bars has no value until k bars exist, and an absent value reaching a plot draws a gap rather than a zero. There is no separate warmup phase: the whole of it is the absent value.
Fix. Nothing, if the length is what you wanted. Warmups add up, so sma(ema(close, 10), 10) is absent until bar 18, and every function's first bar is stated in its reference entry. If you genuinely want a number during warmup, ask for one:
// A fixed 50 on the first 14 bars. Only do this when a neutral reading is
// genuinely what you mean: it is data you invented.
plot(orElse(rsi(close, 14), 50), "RSI, 50 during warmup")
See Warmup.
My line has holes in the middle of the chart
Cause. Something in the calculation went absent on those bars, and absence spreads through arithmetic all the way to the plot. The usual sources, most frequent first:
| Source | Why it is absent |
|---|---|
| A division by zero | up / down where down is 0 on that bar gives an absent value, not an error |
| A stateful call inside a branch | The call did not run on those bars, so its series is absent there |
volume on a bar whose data states none | Absent, not zero, so anything computed from it is absent on that bar |
| A price missing from the data | A windowed function is absent while any bar in its window is |
| A maths call with no real answer | sqrt() below zero, log() at or below zero |
Fix. Find which term went absent by plotting the terms one at a time. For the branch case the compiler has already told you, with OS8001: compute the call at the top level and use the result inside the branch.
trending = close > sma(close, 50)
e = none

// Holes on every bar that is not trending.
if trending
    e = ema(close, 20)

plot(e, "EMA 20", aqua)
trending = close > sma(close, 50)
// No holes: the average advances on every bar.
e = ema(close, 20)
if trending
signal("TREND")
plot(e, "EMA 20", aqua)See Absent values.
My table is blank, or half of it is
Cause. A cell written with an absent value is blank, just as a plot of an absent value is a gap. Also, the chart shows only the cells the newest bar wrote: a cell() call that did not run on the newest bar leaves its cell empty.
Fix. Convert deliberately, so a reader can tell warmup from a value: isNone(v) ? "warming up" : text(v, 2), or text(v), which writes an absent value as the word none. Declare the table() at the top level and write its cells on the newest bar, with if bar.isLast. The /trading chart draws the first table a study declares, so keep one table per study. See Tables.
The compiler refuses my plot inside an if
Cause. OS3006. plot(), fill(), level() and table() define the fixed shape of the study, and that shape has to be known before bar 0 so the chart can build a legend, an axis and a settings dialog. A plot inside a branch would exist on some bars and not others. An input() inside a branch is refused for the same kind of reason, with OS3007.
trending = close > sma(close, 50)
ema20 = ema(close, 20)

if trending
    plot(ema20, "EMA 20", aqua)
Fix. Move it to the top level and hide it on the bars you want hidden with the absent value.
trending = close > sma(close, 50)
ema20 = ema(close, 20)

// One column, absent on the bars where it is not wanted.
plot(trending ? ema20 : none, "EMA 20", aqua)
The chart looks wrong
The price axis changed format when I added my study
Cause. precision and format on a plot() set the formatting of the price scale that plot uses. On a study drawn over the price pane, that scale is the instrument's own axis, so the study reformats the chart underneath it. The compiler warns with OS8007.
Fix. Set precision on the declaration, which applies to the study, rather than on a plot drawn over the price pane.
version 1

study("Average", overlay = true, precision = 2)

average = sma(close, 20)
plot(average, "Average", orange)
My plot is a sloping line between two daily values
Cause. A higher timeframe value changes once per daily bar and stays constant across every intraday bar inside it. Drawn as an ordinary line, the chart joins yesterday's reading to today's with a slope, suggesting intraday values that were never read.
Fix. Use style = "step". A step plot says what the data says: the value held, then changed.
version 1

study("Daily bias", overlay = true)

biasAverage = req.timeframe("1D", ema(close, 20))
plot(biasAverage, "Daily EMA 20", orange, width = 2, style = "step")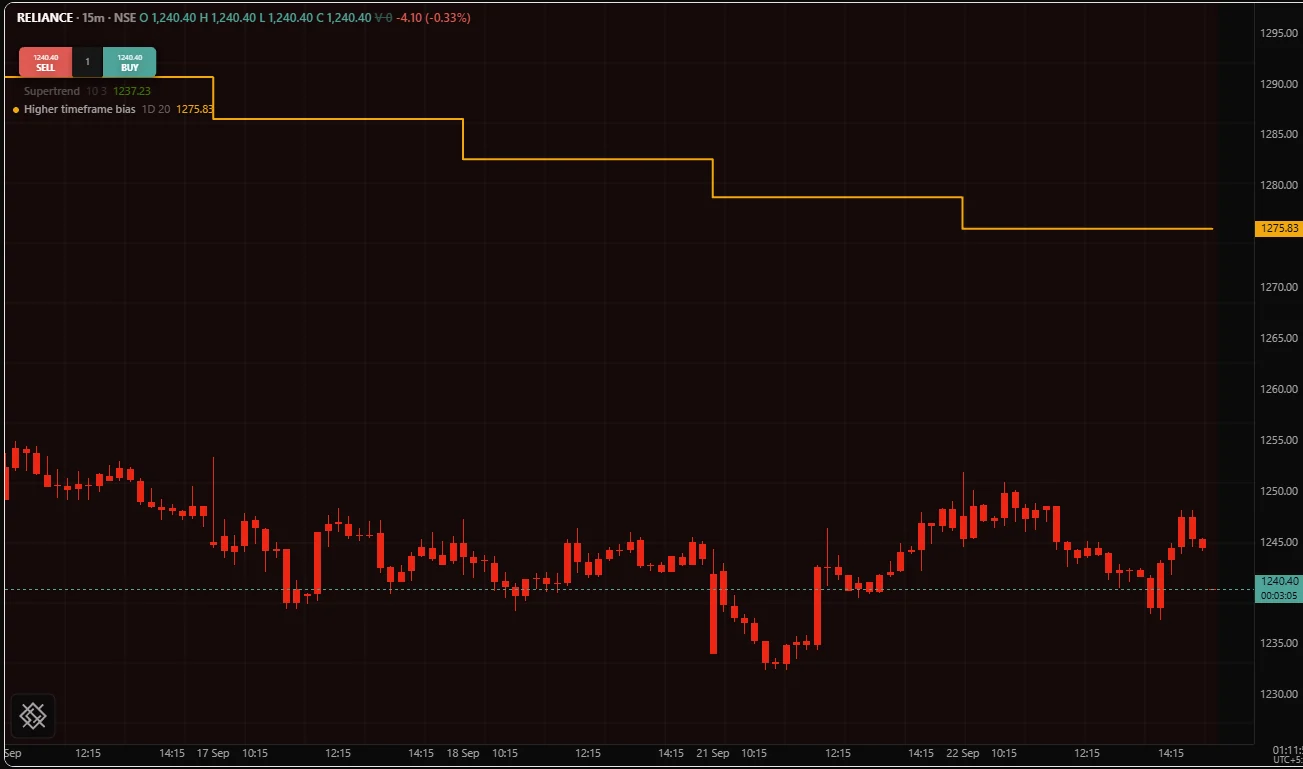
See Higher timeframes.
My colour made everything invisible
Cause. fade() takes transparency, not opacity, as a percentage. fade(aqua, 90) is nearly invisible and fade(aqua, 10) is nearly solid. The two conventions are opposites, and a script that guesses wrong draws nothing you can see.
Fix. Use fade() when you are thinking "how see-through", and withAlpha() with a value from 0 to 1 when you are thinking "how solid". fade(c, 90) and withAlpha(c, 0.1) describe the same colour from the two sides.
// Both give a faint aqua: 90 percent see-through, 10 percent solid.
faint = fade(aqua, 90)
alsoFaint = withAlpha(aqua, 0.1)

background(close > open ? faint : alsoFaint)
A colour channel written as a literal outside its range, such as rgb(300, 0, 0), is refused by the compiler with OS3004 rather than clamped. See Colors.
Values, names and warmup
My running total is absent on every bar
Cause. A plain assignment is recomputed from scratch on every bar. A name that reads its own previous value through [1] reads an absent value on bar 0, the addition spreads that absence, and the series stays absent for ever after.
// Absent on bar 0, and absent for ever after.
barCount = 0
barCount = barCount[1] + 1
plot(barCount, "Bars")
Fix. Use var, the language's way of saying "keep this from one bar to the next". See Persistence.
// 1, 2, 3, and so on.
var barCount = 0
barCount = barCount + 1
plot(barCount, "Bars")
My counter counts updates instead of bars during the session
Cause. You used live var. An ordinary var is restored before each run of the forming bar, which is what makes running the newest bar ten times give the same answer as running it once. live var opts out of that on purpose, and the compiler says so with warning OS8011.
Fix. Use var. Keep live var for the one case it exists for, counting updates within a bar on purpose, and expect the chart and a backtest to differ when you do. See Realtime and confirmation.
My comparison is neither true nor false
Cause. If either side of <, <=, > or >= is absent, the result is absent, not false. So a > b being false does not mean a <= b is true: during warmup both are absent and both branches are skipped. A condition that is absent takes the false branch.
Fix. That is the correct behaviour, and it keeps not (a > b) equal to a <= b for every input. When you need to know, ask with isNone(), or with == and !=, which never return absent. An ordered comparison with none written on one side is absent on every bar, which is warning OS8012:
missing = close > none
plot(isNone(missing) ? 1 : 0, "Always absent")
The compiler says a name is not defined, and I can see it three lines up
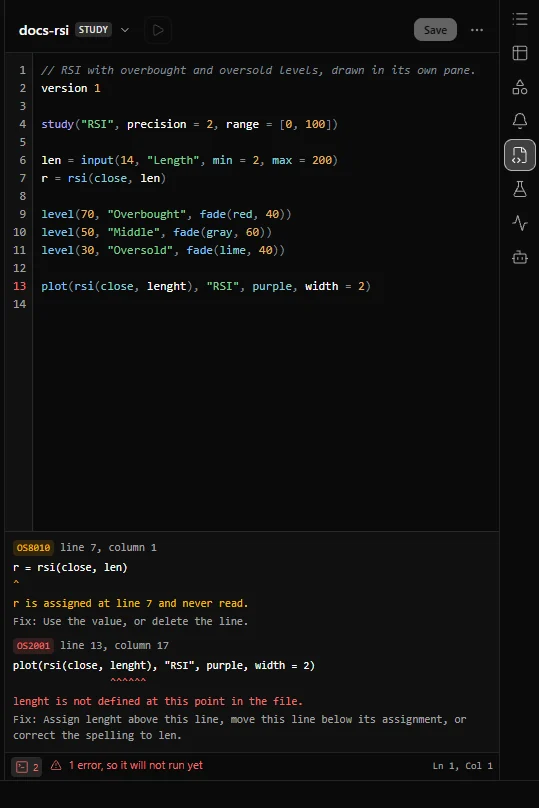
Cause. One of two rules. Either the name was first assigned inside a block, so it belongs to that block and is invisible outside it, or the name is read above the line that assigns it. The file runs top to bottom on every bar, so order matters. This is OS2001.
volatile = high - low > atr(14)

if volatile
    scratch = high - low  // declared inside the block

plot(scratch, "Scratch")  // not visible here
Fix. Assign it at the top level before you read it. Functions are the one exception: an fn may be called before its declaration appears.
volatile = high - low > atr(14)

scratch = none  // declared at the top level
if volatile
    scratch = high - low  // updates the existing name

plot(scratch, "Scratch")
See Variables and scope.
The compiler says the name already exists
Cause. OS2002. A second declaration of a name that already exists outside is an error: a var of the same name inside a block, a loop counter or function parameter named like a top-level value, or a function body that assigns to a top-level name. So is assigning to a library name such as close, ema(), aqua or level(), because the library lives in the outermost scope. Many library names are ordinary words: variance, count, change, level and median are all taken.
Fix. Rename yours. The message names the line of the other declaration, or says it is built in, so you can see what you collided with.
My values changed when the chart loaded more history
Cause. One of two things. You stored bar.index in a var: it is a position in the bars the engine was given, not a fixed address, so loading more history renumbers every bar and the stored number now points somewhere else. Or a value depends on where the history starts, such as cum() or a var counter that began on bar 0: more history is a different starting point, so a different total.
Fix. Store time and compare timestamps, because a bar's time never moves. Anchor a running value to something that does not move either, such as the start of a session or a date, rather than to the first bar on the chart.
Warmup quietly changed an answer
Cause. An if whose condition can be absent takes the false branch during warmup, so a name the block assigns keeps whatever it held before, and those bars sit off the left edge where nobody looks.
Fix. Decide what warmup means and write it down: test isNone(cond) explicitly, or give the name a starting value above the if that you are happy to see on warmup bars.
Signals and alerts
My signal fires on every bar of a trend
Cause. The condition tests a state, not a change. fast > slow is true on every bar of an uptrend, so it marks every bar.
Fix. Test the moment it changes. crossUp() is true on exactly the bar where a was at or below b and is now above. Where the event is not a crossing, compare with the previous bar.
fast = ema(close, 9)
slow = ema(close, 21)
up = fast > slow

// Once, on the crossing bar.
if crossUp(fast, slow)
    signal("BUY")

// The same idea by hand, for a condition that is not a crossing.
if up and not orElse(up[1], false)
    signal("TURNED UP")
My signal never fires
Cause. Four candidates, most frequent first:
- The condition is absent rather than false, and an absent condition takes the false branch. This is warmup, a missing
volume, or a division by zero. - The bar is still forming.
signal(),alert()and orders wait until the bar is confirmed, and if the condition is no longer true when the bar closes they never happen at all. - The condition is never true. If it is constant, the compiler says so with warning OS8017.
- A guard above it does something you did not intend, such as an ordered comparison against
none.
Fix. Plot the condition as cond ? 1 : 0 and look at the line, as in Two habits first.
My alert never arrives
Cause. Everything in the previous entry applies, and two things are specific to alerts on the /trading page. Nothing fires for bars that were already on the chart when the study was added, because an alert is a statement about now. And in this release the chart checks a script's alert() once for each new bar, at the moment that bar first arrives. During market hours a bar arrives with its first tick, before it has closed, while the alert waits for its bar to close, so at that moment it has nothing to report and the chart does not look at that bar again. The alert fires only for a bar that reaches the chart already closed, which you cannot rely on while the market is open.
Fix. Plot the condition as 1 or 0 and put a study alert on that plot: open Create alert from the chart's Alerts button, set What to watch to Study plot, pick the study and its plot, and set Evaluate to On bar close. Alerts on a script condition walks through it. Keep a fixed id on every alert() in the script as well: without one its identity comes from its line number, which moves when you edit the file, and the compiler warns with OS8008.
fast = ema(close, 9)
slow = ema(close, 21)
crossed = crossUp(fast, slow)

// The line a study alert can watch: 1 on the crossing bar, 0 otherwise.
plot(crossed ? 1 : 0, "Fast crossed above slow", fuchsia, style = "step")

if crossed
    alert("Fast crossed above slow at " + text(close, 2), id = "cross-up")
My marker sits on the wrong side of the bar
Cause. The call did not say where the marker goes, so it took the default, at = "above". The side is never worked out from what the marker says.
Fix. Say which: at = "above", "below" or "price", and choose a shape. The value must be written as a literal or come from an input(), because a marker's look is fixed before bar 0; a value that changes per bar is OS3003.
fast = ema(close, 9)
slow = ema(close, 21)

if crossUp(fast, slow)
    signal("BUY", at = "below", shape = "arrowUp")
Higher timeframe and other instruments
My higher timeframe read is empty
Cause. Work down this list:
| Code | Means |
|---|---|
| OS6001 | The timeframe string is not a timeframe. Minutes are a number in a string, "5" or "60"; a day is "1D" |
| OS6002 | The request is finer than the chart. Folding cannot invent bars that were never loaded |
| OS6015 | The request is not a whole multiple of the chart's interval, such as "7" on a 5 minute chart |
| OS6007 | The host does not know that symbol on that exchange |
| OS6008 | The instrument returned no bars over the range the chart covers |
| OS6009 | The request failed: a connection, permission or quota problem in the host |
Beyond those, a req.symbol() read is simply absent until the host answers, which is not instant.
Fix. Check req.isReady() before acting on the value, and req.error() for the reason when a read failed. The unit letters are case sensitive: "1M" is one month and "1m" is one minute.
niftyDaily = req.symbol("NIFTY", "1D", close, exchange = "NSE_INDEX")

// req.error() is an empty string until something goes wrong.
failure = req.error(niftyDaily)
panel = table("NIFTY read", 1, 1, position = "bottomRight")
if bar.isLast and failure != ""
    cell(panel, 0, 0, "NIFTY read failed: " + failure)

plot(req.isReady(niftyDaily) ? niftyDaily : none, "NIFTY daily close", orange, style = "step")
See Other instruments.
My markers move when I reload the chart
Cause. The study repaints: what it showed on a bar while that bar was live differs from what it shows for the same bar on history. The usual causes are a higher timeframe read with mode = "lookahead", which gives every chart bar the final value of its higher timeframe bar, and onUnconfirmed = true in the declaration, which lets signals and orders act on a bar that is still forming. A mode = "developing" read also moves on the newest bars until the higher timeframe bar closes.
Fix. mode = "confirmed" is the default and the only mode that never repaints. A "lookahead" read raises warning OS8005. If you set onUnconfirmed = true deliberately, guard every decision with bar.isConfirmed, and expect warning OS8002 on every higher timeframe read in the file. The /trading legend does not mark a repainting study in this release, so these warnings in the console are your notice. See Repainting.
Strategies, orders and backtests
My backtest and the running strategy disagree
Cause. Usually not a bug. A backtest decides fills from bars, and a running strategy gets the fills the market gives it. The candidates, in the order worth checking:
| Cause | What to look at |
|---|---|
| Fill timing | fillOn defaults to "nextOpen": the backtest fills a decision at the next bar's open, because a decision made from a bar's close cannot be filled at that same close |
| Costs | slippage, commission and commissionType are what the backtest charges on every fill; set them to what you actually pay |
A live var | It is not restored, so it counts updates while running and bars in a backtest |
onUnconfirmed = true | A running strategy acts on a bar that is still forming; the backtest only ever saw it closed |
| A repainting read | A "lookahead" read knows each higher timeframe bar's final value on history and not while it forms |
| A stop and a target in one bar | A backtest cannot see the path inside a bar, as the entry below explains |
Fix. Read the declaration first: most of those are options on one line. Leave fillOn = "nextOpen" alone unless you can say why the other is honest for your market. See Costs and fills.
My strategy did nothing when I ran it
Cause. In order of likelihood:
- It is not running. Each deployment in the Strategies panel shows whether it is running or stopped, and a run can stop on its own, on an error or a refused order.
- It is trading in sandbox. A running strategy sends orders through OpenAlgo's own order path, so while OpenAlgo is in analyzer mode its orders go to sandbox trading (analyzer mode in OpenAlgo), not to your account. The Strategies panel header says Live or Analyzer, and the start button says Start live or Start in sandbox.
- The condition has not been true since it started. Orders wait for a confirmed bar, and a strategy acts only on bars that arrive after it starts.
- The instrument was outside its trading session. Nothing in the script checks this for you.
Fix. Check the deployment's row and the mode in the Strategies panel header. To check the logic itself, open the script in the Scripts panel and press Apply to chart: for a strategy, that runs a backtest over the chart's history and marks every fill on the price. On the chart and in the Backtest panel, guard entries to the session with session.isIn() and a named zone, such as session.isIn("0915-1530", "Asia/Kolkata"). A deployed strategy cannot read the clock that way, because the Strategies panel refuses a script that calls session.* or date.* on an Indian instrument, so there build the window from arithmetic on time. closeOnSessionEnd = true is accepted and not acted on in version 0.5.0, so a strategy that must be flat at the close needs its own exit. See Sandbox and live and Sessions and time.
My strategy stopped on an order error
Cause. An order the script placed broke a rule, and the strategy stopped on that bar with an OS7xxx error. In a backtest this looks like a run that trades for a while and then does nothing more. The code says which rule:
| Code | Means | Usual reason |
|---|---|---|
| OS7002 | An order argument is absent | A stop or a quantity computed from a window that has not filled yet |
| OS7004 | The quantity is zero or negative | A sizing formula rounded down to 0 |
| OS7008 | The entry was refused by pyramiding | A second entry in the same direction while pyramiding allows one |
| OS7013 | Two opposite orders on one bar | An exit and an entry, or a buy and a sell, from two conditions that can both be true |
| OS7016 | A close names a tag nothing places | A typo in a close tag, reported when the file compiles |
| OS7017 | A close asks for more than is left to close | A qty on close() larger than what the position or tag still holds, less anything already working against it |
Fix. For an absent argument, guard the call rather than defaulting the value, because an order is the one place where doing nothing quietly is worse than stopping loudly. This entry sizes each trade so the stop risks a fixed amount, and does nothing until every number exists:
version 1

strategy("Sized from the stop", overlay = true, qtyType = "units", qty = 1)

riskAmount = input(5000, "Amount risked per trade", min = 1)

fast = ema(close, 9)
slow = ema(close, 21)
crossed = crossUp(fast, slow)
stop = lowest(low, 20)
// The zone is named, so the window also holds in the Backtest panel.
inSession = session.isIn("0915-1530", "Asia/Kolkata")

// Absent until the 20 bar window fills, and zero when the stop is too wide
// for the amount risked. Either way the entry below does nothing.
distance = close - stop
qty = distance > 0 ? floor(riskAmount / distance) : none

// The script tests its own stop: the 0.5.0 backtest does not fill a stop
// set with exit().
var stopLevel = none

if pos.isLong and close < stopLevel
    close()
else if crossed and inSession and pos.isFlat and not isNone(qty) and qty > 0
    buy(qty = qty)
    stopLevel = stop
For OS7013, make the conditions exclusive with else if, so at most one order is placed per bar. Compute the crossings at the top level so both keep advancing on every bar:
version 1

strategy("Add on strength", overlay = true, qty = 1, pyramiding = 2)

fast = ema(close, 9)
slow = ema(close, 21)
up = crossUp(fast, slow)
weak = crossDown(fast, slow)
newHigh = close > highest(high, 20)[1]

// One order per bar at most. Written as separate ifs, a bar that is both weak
// and a new high would place close() and buy() together, which is OS7013.
if weak and not pos.isFlat
    close()
else if up and pos.isFlat
    buy()
else if newHigh and pos.size == 1
    buy()
For OS7016, fix the spelling so the tag on close() matches the one on the entry:
fast = ema(close, 9)
slow = ema(close, 21)

if crossUp(fast, slow)
    buy(qty = 1, tag = "entry")

if crossDown(fast, slow)
    close(tag = "entyr")
For OS7017, leave the quantity off close() and it closes whatever is left, or guard a partial exit on pos.size so it cannot fire twice on one position. The engine will not send a smaller number for you: that would be a quantity you did not write.
My strategy stopped after its first entry
Cause. pyramiding defaults to 1: one entry in each direction. An entry condition that stays true, such as fast > slow, asks for a second entry on the next bar while the first is still open, and that is OS7008. The strategy stops on that bar rather than quietly ignoring the order.
Fix. Test the position, which also makes the intent readable. Raise pyramiding in the declaration only if you really mean to add to a position.
fast = ema(close, 9)
slow = ema(close, 21)

if crossUp(fast, slow) and pos.isFlat
    buy(qty = 1)

if crossDown(fast, slow) and not pos.isFlat
    close()
My stop was hit in real trading and not in the backtest
Cause. A backtest sees bars, not ticks. The order in which a bar made its high and its low, and the path between them, is not in the data. A stop and a target that both sit inside one bar's range cannot be resolved from that bar, and the fill model has to choose.
Fix. Do not treat a backtest as a tick-accurate simulation of what happens inside a bar. Test the same rule on a shorter interval, where each bar hides less of the path, and size the stop so that being wrong about the path inside one bar does not decide the result. See Backtesting.
Numbers and performance
My indicator disagrees with another implementation's numbers
Cause. Two implementations of the same named indicator often differ in three places: how a smoothed average is seeded, whether a standard deviation divides by the window length or one less, and how halves are rounded. All three are fixed in OpenScript and stated per function.
Fix. Check the three. ema() is seeded on bar len - 1 with the simple average of those len values. stdev() and variance() divide by len, the population form, and take sample = true for the other. round() takes halves away from zero. Then check the warmup: an implementation that starts a bar earlier or later has a different first value, and so a different smoothed series for ever after.
My loop ran out of budget
Cause. OS5001. Every turn of every loop in one bar counts against a budget of 2,000,000 per bar. The bar stops rather than breaking out of the loop, because a loop cut short produces a plausible wrong number.
Fix. Either the exit condition is wrong, which the named line shows you, or the script genuinely needs more, and you raise the budget in one place with limits(loops = n) straight after the declaration. See Limits.
Also check for the descending loop that never runs: for i = 9 to 0 runs zero times and needs step -1. The compiler warns with OS8015.
total = 0.0
for i = 9 to 0 step -1
    total += close[i]

plot(total, "Sum of the last 10 closes")
My script is slow, or a bar timed out
Cause. Almost always recomputation: a loop that walks the whole history on every bar, so the work grows with the square of the chart's length. A host that sets a time budget per bar stops it with OS5007.
Fix. Keep a running value in a var and update it per bar, or use the library functions that already do the work: highest(), sum(), cum(), barsSince() and valueWhen().
// Before: 200 turns of a loop on every bar.
total = 0.0
for i = 0 to 199
    total += close[i]

plot(total, "Sum of 200 closes, by loop")
// After: one library call. It still adds 200 closes on each bar, but inside
// the engine rather than as turns of your own loop.
plot(sum(close, 200), "Sum of 200 closes")See Profiling and speed.
The compiler rejects a character I cannot see
Cause. OS1001. Outside a string or a comment, the language accepts ASCII letters, digits, spaces, newlines and its own punctuation, and nothing else. A non-breaking space or a curly quotation mark pasted from a web page or a document is invisible in every editor, and refusing it where it sits stops it causing a baffling error three tokens later.
Fix. The message names the plain character to use instead. Related refusals from the same family: a tab in the indentation (OS1002, indent with spaces), a semicolon (OS1007, put the second statement on its own line), ! (write not), && and || (write and and or), and ^ (write pow(a, b)).
bullish = close > open && volume > 0Still stuck
Try three things before anything else. Read the warnings, because they describe exactly the shapes that produce puzzling behaviour. Plot the intermediate value, because a gap and a flat zero look the same in your head and completely different on a chart. And look the code up in the error reference, where every code has a cause, a fix and a before and after example. Debugging walks through finding the exact bar and line that goes wrong.
Related. Debugging, Reading an error, Warmup, Absent values, Repainting, FAQ, Glossary