
Your first strategy
Turn the EMA cross study into a strategy with buy and close, give it costs, a stop and a target, then backtest it from the Backtest panel in /trading.
On this page
A strategy is a study that also places orders. This page takes the EMA cross study from the Quickstart and turns it into a strategy one step at a time: first the orders, then realistic costs, then a stop and a target. Then it runs the strategy over history in the Backtest panel and explains every figure the panel reports. By the end you have a strategy you can deploy to sandbox trading (analyzer mode in OpenAlgo) from the Strategies panel.
A strategy is a study with orders
There is no separate strategy language and no separate file type. You change the word study to strategy in the declaration, and the order functions become available in the same file that is already doing the plotting. Calling buy() in a file declared with study() is OS7001, and the first fix it offers is exactly that change.
This is the point of the design, not a convenience. The averages on the chart and the averages the strategy trades on are written once, in the same lines of the same file, so what you see and what you backtest are the same calculation and cannot drift apart.
Step 1. Change the declaration and add orders
In the Scripts panel, create a new script called ema-cross-traded with Kind set to Strategy, and replace its starter with this. Compared with the study, the word study has become strategy, and the two signal markers at the end have become orders:
version 1

strategy("EMA cross, traded", overlay = true, precision = 2)

fastLen = input(9,  "Fast length", min = 1, max = 500)
slowLen = input(21, "Slow length", min = 1, max = 500)
src     = input(close, "Source")

fast = ema(src, fastLen)
slow = ema(src, slowLen)

fastPlot = plot(fast, "Fast", aqua, width = 2)
slowPlot = plot(slow, "Slow", orange, width = 2)
fill(fastPlot, slowPlot, fade(aqua, 90))

goLong = crossUp(fast, slow)
goFlat = crossDown(fast, slow)

if goLong and pos.isFlat
    buy()

if goFlat and pos.isLong
    close()
Four things are worth knowing about those last lines.
buy()with no arguments is a market order for the strategy's default quantity, which is 1 unless the declaration says otherwise. A market order fills at the next price available. Give itlimit =and it becomes a limit order, which fills only at that price or better; give itstop =and it becomes a stop order, which waits until the price reaches that level.close()flattens the position, closing all of it so the strategy holds nothing. The same word, read without brackets, isclose, the bar's closing price. The compiler tells them apart by the brackets, soema(close, 9)andclose()mean different things in one file.- The position is read from fills, not intentions.
pos.isFlatandpos.isLongchange only when an order has actually filled. The guards stop a second buy while already long, and a close while already flat. - Signals are computed at the top level.
goLongandgoFlatare worked out on every bar and then tested inside theif. A stateful call such ascrossUp()written inside a branch would only advance on the bars that branch runs, which the compiler warns about as OS8001.
Step 2. Apply it and see the trades
Save with Save or Ctrl+S, and wait for Ready in the status bar. Now press Apply to chart, the play button beside the script's name.
For a strategy, Apply does two things at once. It adds the strategy's plots to the chart with a legend row and a settings dialog, exactly as for a study. Then it switches the right-hand panel to Backtest, selects this strategy and runs it over the history of the instrument on the chart. Every fill is marked on the price with an arrow and a label that says what it did and its signed size: Long and +1 where a long opened, Exit long and -1 where it closed. The strategy in this picture also trades short, so it shows Short and Exit short marks as well.
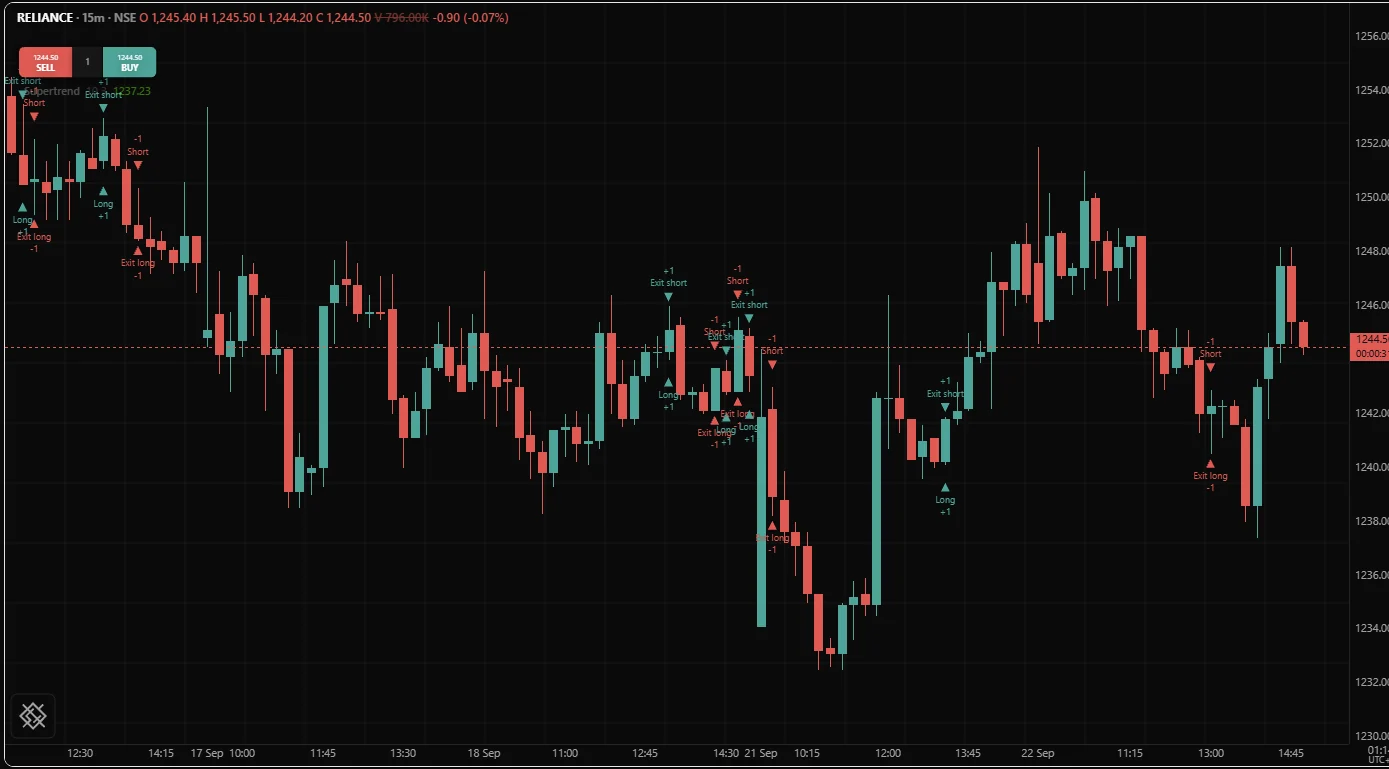
Nothing is sent to your broker. The marks come from the Backtest panel's run, which simulates the orders in your browser, so every mark on the chart is a fill of a trade listed in the panel's report.
Step 3. Say what trading costs
A backtest with no costs flatters every strategy, and most of all a strategy that takes many small profits. The declaration is where a strategy states its capital, its order size and its costs. Replace the strategy(...) line with the declaration below, and leave the rest of the file, including the version 1 line, as it is:
version 1

strategy("EMA cross, traded", overlay = true, precision = 2,
         capital = 500000, qty = input(1, "Quantity", min = 1), qtyType = "units",
         pyramiding = 1, fillOn = "nextOpen", slippage = 1,
         commissionType = "perTrade", commission = 20)
A declaration can run over several lines: the open bracket carries it on until the matching close. strategy() accepts every option study() does, so overlay and precision mean what they meant before. The rest are trading options:
| Option | Default | Means |
|---|---|---|
capital | 100000 | Starting equity for the backtest, in the instrument's currency |
qty | 1 | Order size when an order names none. Written as an input(), it becomes a setting you can change |
qtyType | "units" | What qty counts: "units", "lots", "cash" or "equityPercent" |
pyramiding | 1 | How many entries in one direction are allowed before another is refused |
fillOn | "nextOpen" | Where an order is filled: at the next bar's open, or "close" of the signal bar |
slippage | 0 | How many ticks (the instrument's smallest price step) each market or stop fill is moved against you |
commission | 0 | The charge, in the unit commissionType names |
commissionType | "perTrade" | "perTrade" (per order), "perUnit" or "percent" |
product | "intraday" | "intraday" for a position closed the same day, or "overnight" for one carried |
Slippage is the gap between the price you expected and the price you got. A limit order fills at its own price or not at all, so slippage is not charged on it.
Two of those defaults are deliberate and worth keeping.
- Fill at the next bar's open. A decision made from a bar's close cannot be filled at that same close in a real market: by the time the bar has closed, the price has gone. The next open is what actually happens to you, so it is what the backtest does unless you say otherwise.
- Costs start at zero because OpenScript will not guess yours. Set them. With
commission = 20andcommissionType = "perTrade", each order is charged 20, so a round trip costs 40. On an NSE stock trading near 1,250, a one share position has to move more than 40 rupees just to break even, which is exactly the kind of fact a backtest exists to tell you.
For NSE and BSE equities, "units" means shares. For futures and options on NFO or MCX, where you trade in lots, keep qtyType = "units" and state the size in units (a multiple of the lot size): the Strategies panel sends only quantities stated in units.
Step 4. A stop and a target
A stop limits what a trade can lose, and a target takes the profit. Here both are set from the average true range (atr()), a measure of how far price typically moves in one bar, gaps included, at the moment of entry, held in var variables so they stay fixed for the life of the trade, and checked on every bar:
atrLen     = input(14,  "ATR length", min = 1, max = 200)
stopMult   = input(1.5, "Stop, in ATR", min = 0.2, max = 20)
targetMult = input(3.0, "Target, in ATR", min = 0.2, max = 40)

fast     = ema(close, 9)
slow     = ema(close, 21)
atrValue = atr(atrLen)

var entryStop   = none
var entryTarget = none

if crossUp(fast, slow) and pos.isFlat and not isNone(atrValue)
    entryStop   = close - stopMult * atrValue
    entryTarget = close + targetMult * atrValue
    buy()

stopHit   = pos.isLong and close < entryStop
targetHit = pos.isLong and close > entryTarget

if pos.isLong and (stopHit or targetHit)
    entryStop   = none
    entryTarget = none
    close()
How it works:
var entryStop = nonecreates the variable once and keeps its value from bar to bar. A plain assignment would be recomputed on every bar, and the stop would drift with the market. See Persistence.not isNone(atrValue)skips the entry while the ATR is still warming up. On the first 13 barsatr()has no value, so a stop computed from it would benonetoo. A trade entered then would have no stop at all:close < entryStopis never true whileentryStopisnone. The guard makes sure every trade starts with both levels set.- The exit tests the bar's close against the levels and calls
close(), which fills at the next bar's open. On a gap, that open can be beyond the level, and the backtest reports the price you would really have got.
The finished strategy
Everything together, with the stop, target and entry price drawn on the chart while a trade is open:
version 1

strategy("EMA cross, traded", overlay = true, precision = 2,
         capital = 500000, qty = input(1, "Quantity", min = 1), qtyType = "units",
         pyramiding = 1, fillOn = "nextOpen", slippage = 1,
         commissionType = "perTrade", commission = 20)

fastLen    = input(9,   "Fast length", min = 1, max = 500)
slowLen    = input(21,  "Slow length", min = 1, max = 500)
src        = input(close, "Source")
atrLen     = input(14,  "ATR length", min = 1, max = 200)
stopMult   = input(1.5, "Stop, in ATR", min = 0.2, max = 20)
targetMult = input(3.0, "Target, in ATR", min = 0.2, max = 40)

fast     = ema(src, fastLen)
slow     = ema(src, slowLen)
atrValue = atr(atrLen)

goLong = crossUp(fast, slow)
goFlat = crossDown(fast, slow)

// Held in var, so the levels stay where they were set on the entry bar
// instead of moving with each new bar's volatility.
var entryStop   = none
var entryTarget = none

if goLong and pos.isFlat and not isNone(atrValue)
    entryStop   = close - stopMult * atrValue
    entryTarget = close + targetMult * atrValue
    buy()

stopHit   = pos.isLong and close < entryStop
targetHit = pos.isLong and close > entryTarget

if pos.isLong and (goFlat or stopHit or targetHit)
    entryStop   = none
    entryTarget = none
    close()

fastPlot = plot(fast, "Fast", aqua, width = 2)
slowPlot = plot(slow, "Slow", orange, width = 2)
fill(fastPlot, slowPlot, fade(aqua, 90))

plot(pos.isLong ? entryStop : none, "Stop", red, style = "step")
plot(pos.isLong ? entryTarget : none, "Target", lime, style = "step")
plot(pos.isLong ? pos.avgPrice : none, "Entry", fade(silver, 40), style = "step")
The last three plots use style = "step", which draws each level as a flat line that jumps when the value changes. They show a value only while pos.isLong is true and draw nothing otherwise, which is how a plot is hidden: give it none, never wrap it in an if (OS3006). Because the levels are held in var, the red and green lines are the levels the trade was actually opened with, not levels recomputed from today's volatility.
Backtest it
Save, then open Backtest on the right-hand toolbar and choose the strategy.
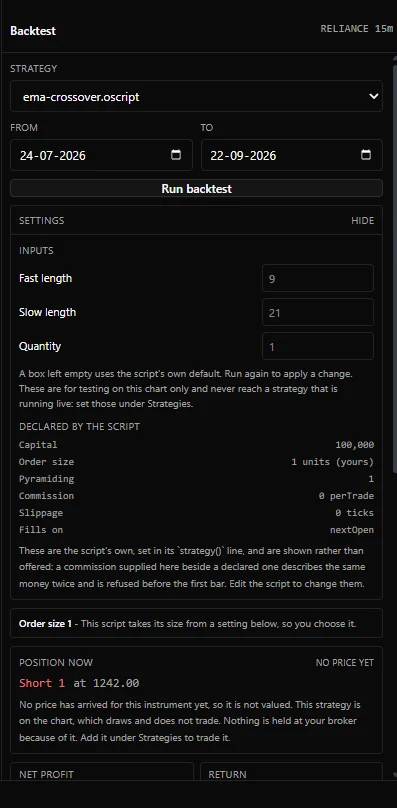
The panel runs a saved strategy over the history of the instrument and timeframe on the chart. There is no symbol box on purpose: a backtest of something other than what you are looking at is the result most easily misread. The header shows what the run is of, for example RELIANCE 15m.
| Control | What it does |
|---|---|
| Strategy | Every saved script that declares itself a strategy. Studies are not listed: a study places no orders, so it has nothing to backtest |
| From, To | The date range. It starts at two months back on a minute timeframe, two years on an hourly or daily one, five years on weekly and ten on monthly, until you set dates yourself |
| Run backtest | Runs the strategy with the current dates and settings. It reads Running while it works |
| Settings | Opens by itself when the script declares inputs. One box per input(); a box left empty uses the script's own default |
A run starts on its own when you choose a strategy or when the chart's instrument or timeframe changes. A change to a date or a setting waits for Run backtest, so a half typed value never starts a run.
Under Settings, the panel also lists what the strategy Declared by the script: Capital, Order size, Pyramiding, Commission, Slippage and Fills on. These come from the strategy() line and are shown rather than offered: to change them, edit the script. The only exception is a size you made an input, as qty = input(1, "Quantity", min = 1) does above, which the panel marks (yours) and lets you set. Values typed here are for testing on this chart only; they never reach a strategy running from the Strategies panel.
A run covers up to 100,000 bars and happens in your browser, compiled from the same saved text as the program a deployed strategy runs. Nothing is sent to a broker. The run reads the instrument's tick size and lot size from OpenAlgo; if it cannot find them, it says so and uses a tick of 0.05 and a lot of 1, and every money figure rests on those.
Reading the report
When the run finishes, the panel shows its figures, an equity curve, a line such as 12 fills marked on the chart. 1,050 bars, 40ms. Tick 0.05, lot 1., and a table of every trade.
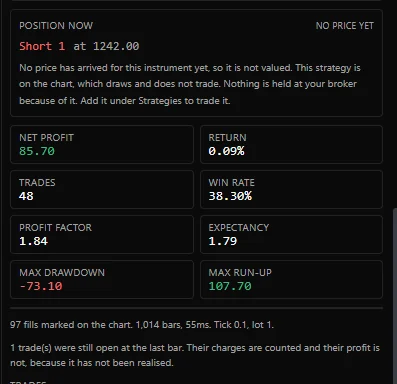
| Figure | Is | Read it knowing |
|---|---|---|
| Net profit | Realised profit over the range, after the costs the script declared | It is gross of every cost you left at zero |
| Return | Net profit as a percentage of capital | It says nothing about how much of the time that capital was in use |
| Trades | Closed trades in the range | Under about thirty trades, the figures below are anecdotes |
| Win rate | The share of closed trades that made money after charges | Meaningless alone: a high win rate with one very large loser is a losing strategy |
| Profit factor | Gross profit divided by gross loss | Below 1 the strategy loses. A dash means it cannot be worked out, for example when no trade lost |
| Expectancy | The average net profit per closed trade | The number that scales with how often you trade |
| Max drawdown | The largest fall in equity from a peak, shown as a negative amount | Read this first. It decides whether you could have stayed with the strategy |
| Max run-up | The largest rise in equity from a low point | The best stretch the run had. Set it beside the drawdown, not in place of it |
Equity here is the capital plus the profit so far, with an open position valued at each bar's close.
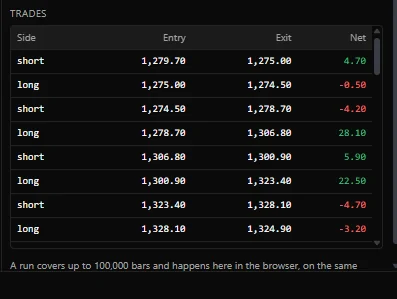
The Trades table lists each trade's Side, Entry, Exit and Net. A trade still open at the last bar reads open in the Exit column; its charges are counted and its profit is not, because it has not been realised. When the run ends holding a position, a Position now box shows it, marked to the latest price OpenAlgo has for the instrument, with a reminder that nothing is held at your broker because of it.
Three ways a good looking report can mislead you, all of them under your control:
- Costs left at zero. Set
commissionandslippagebefore you believe anything. - A fill model that is too kind.
fillOn = "close"fills you at a price that had gone by the time you decided. Keep the default. - Too few trades. Widen the range or use a shorter timeframe until the trade count means something.
From backtest to sandbox
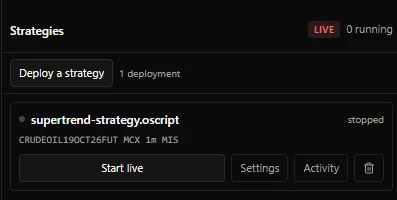
A backtest says what would have happened. The next step is to watch the strategy trade on its own as new bars arrive, with no money at risk. Open Strategies on the right-hand toolbar and click Deploy a strategy. Choose the strategy, then the instrument, exchange, interval and product, fill in any settings, and click Deploy. The deployment appears as a row. The panel's header shows Analyzer or Live. While OpenAlgo is in analyzer mode, the row's start button reads Start in sandbox, and every order goes to the sandbox rather than to your broker. In live mode, as in the picture below, it reads Start live, and orders go to your broker. The mode is set elsewhere in OpenAlgo, not in this panel, so check the header before you press the button.
A deployed strategy runs as a process on the OpenAlgo server, so closing the browser stops nothing. The server runs the compiled program saved beside your script, which is why a strategy must be saved without errors before it can be started.
The server refuses to start a script that does any of these, and the refusal names the reason:
- calls
exit()ororder.bracket(); - reads the session or the calendar, for example
session.isFirstBaror thedate.*functions; - sizes its orders in anything but units;
- reads another timeframe or another instrument with
req.timeframe()orreq.symbol(); - creates drawing objects or tables.
The strategy on this page does none of those. The Sandbox and live page covers deployment in full.
When nothing trades
A strategy that compiles, runs and never trades raises no error. Work down this list:
- Is the entry condition ever true? Plot it for a moment on its own axis, so the price scale is not squashed:
plot(goLong ? 1 : 0, "Entry", scale = "left"), and look for the spikes. - Is it only true during warmup? The
not isNone(atrValue)guard blocks entries until the ATR has a value. - Did the first trade ever close? If
pos.isFlatnever becomes true again, every later entry is blocked by the guard. - Does the condition read something the panel does not supply? In this release the Backtest panel does not tell the engine the chart's interval, its timezone or the session's hours. So
chart.interval,session.isFirstBarandsession.isLastBarhave no value in a backtest, and neither has a day, week or monthreq.timeframe()read, or asession.isIn()ordate.*call that names no zone. A condition built on them is never true. Name the zone, as insession.isIn("0915-1530", "Asia/Kolkata"), and filter on an intraday read such as"1h", which the backtest folds from the chart's own bars.
Two more cases show a message instead of a report:
- A range where the instrument did not trade, over a holiday or before listing, returns no bars, and the panel says "No bars came back for that instrument over that range."
- A range that is too long. More than 100,000 bars is refused with a message that names the count. Shorten the range or use a longer timeframe.
Plotting an intermediate value, as in the first question, is the fastest way to answer the first three. See Debugging.
Related. Strategies overview, Orders, Exits and brackets, Position and sizing, Costs and fills, Backtesting, Reading a report, Sandbox and live