
Objects and methods
The objects a script creates in this release, lines, labels, boxes, polylines and tables, and how to create them, change them on later bars, keep their handles and delete them. What user types and method syntax mean today.
On this page
- What this release supports
- A first example
- An object is not a plot
- The four drawing objects
- Anchors are a time and a price
- Verb-first calls instead of methods
- Every change call
- Handles
- Lifetime
- A capped set of objects
- Deleting, and the stale handle
- When to delete
- Objects cannot be read back
- Tables
- Errors you will meet
- User types and methods: what is planned
Most of what a script draws is a column with one value per bar, declared before the first bar and filled in as the bars arrive. An object is different: the script creates it at a moment it chooses, it stays where it was put, and the script can move it, restyle it or delete it any number of bars later. This page covers the objects OpenScript has in this release (the drawing objects line, label, box and polyline, and tables), how a script keeps hold of them with handles, and how to stop them piling up on a long chart. It also says plainly what is not in this release: user-defined types with type, and method call syntax.
What this release supports
| Feature | Status | Written as |
|---|---|---|
| Drawing objects: line, label, box, polyline | Available | draw.line(...), then draw.setTo(handle, ...) |
| Tables | Available | table(...) at the top level, then cell(...) |
Handles held in var, arrays and function arguments | Available | var zone = none, array<box> |
| User-defined record types with fields | Planned. type is a reserved word | Not available |
Method call syntax, handle.setText(...) | Not in version 1 | Use draw.setText(handle, ...) |
| Function values, passing a function as an argument | Planned | Not available |
Writing type today is error OS1019, because the word is reserved for the later version that adds record types:
type = input("fast", "Mode", options = ["fast", "slow"])A function name used as a value is error OS2014:
fn square(x) => x * x
f = square
Everything else on this page works today.
A first example
The most common object script is not a set of objects at all. It is one label, created once and moved every bar: here, a tag beside the latest price showing the close and the 14 bar ATR.
version 1
study("Price tag", overlay = true, precision = 2)

atrLen = input(14, "ATR length", min = 1, max = 200)

spread = atr(atrLen)

var tag = none

// Created once. Creating it on every bar instead would leave one label per
// bar on the chart, all but one of them behind the visible window.
if bar.isFirst
    tag = draw.label(time, close, "", color = fade(black, 20), textColor = white)

// Moved and rewritten every bar. The guard says what the reader needs to know:
// until the label exists there is nothing to move. (A change call given an
// absent handle does nothing, so the guard also keeps the text work from running.)
if not isNone(tag)
    draw.setAt(tag, time, close)
    reading = isNone(spread) ? "warming up" : text(spread, 2)
    draw.setText(tag, text(close, 2) + "  ATR " + reading)
    draw.setTextColor(tag, close > open ? lime : red)
Note the string. There is no automatic conversion from number to text, so "ATR " + spread is error OS2003 and the number has to go through text(). And text() of an absent value is the word "none", which on a chart helps nobody, so the script decides what a warming-up reading looks like and writes that decision in the ternary.
An object is not a plot
| A plot | An object | |
|---|---|---|
| Declared | Once, at the top level, before bar 0 | On any bar, anywhere in the script |
| Shape | One value per bar | Two points, one point, or a path |
| Changed later | No: you give it a new value each bar | Yes: move it, restyle it, change its text |
| Hidden | By giving it the absent value | By deleting it |
| Removed | Never | By draw.delete, and only by that |
The split exists because the two do different jobs. A legend, a price axis and a settings dialog must exist before the first bar runs, so the set of plotted columns is fixed at compile time, and a plot() inside an if is error OS3006. Geometry has no such constraint: a trendline between two swing points is not a column of numbers, and nothing needs to know in advance how many there will be. A value per bar is a plot; a thing with a position is an object.
The four drawing objects
| Call | Anchors | Makes | For |
|---|---|---|---|
draw.line() | draw.line(t1, p1, t2, p2) | a line | A trendline, a level, a ray |
draw.label() | draw.label(t, p, text) | a label | A plate of text at a point |
draw.box() | draw.box(t1, p1, t2, p2) | a box | A zone: supply, demand, an opening range |
draw.polyline() | draw.polyline(times, prices) | a polyline | A path or closed shape through many points |
Each also takes optional styling arguments by name: color, width and style for a line (with extendLeft and extendRight), color, textColor, align and tooltip for a label, color, fillColor, opacity, width, text, textColor and tooltip for a box, and color, width, closed, fillColor and opacity for a polyline. The reference entries list every default.
draw.polyline takes two arrays kept in step, one of times and one of prices, rather than one array of points, because there is no record type to make a point from yet. Here it draws the last five closes as a path, updated in place on the newest bar:
version 1
study("Recent path", overlay = true)

var path = none

if bar.isLast
    times  = [time[4], time[3], time[2], time[1], time]
    prices = [close[4], close[3], close[2], close[1], close]
    if isNone(path)
        path = draw.polyline(times, prices, color = aqua, width = 2)
    else
        draw.setPoints(path, times, prices)
Anchors are a time and a price
Every object is positioned by a timestamp and a price, never by a bar index. That is a rule about correctness. bar.index is a position inside the data the engine happened to be given, so loading more history renumbers every bar and would drag anything anchored to an index sideways. A bar's time does not move.
rightBars = 5
pivot = pivotHigh(high, 5, rightBars)

// The pivot is known only rightBars bars after it happened, so its anchor is
// the time of the bar it happened on, not the time of the bar we are on now.
if not isNone(pivot)
    draw.label(time[rightBars], high[rightBars], "Swing high", color = red)
Subtracting two bar indices within one run is fine, because both come from the same numbering: bar.index - element(zoneBar, i) is a real count of bars. It is storing an index and comparing it after a reload that breaks. The error list includes warning OS8014 for a persistent value holding a bar index, but the compiler does not raise it in this release, so the habit is yours: store time.
Verb-first calls instead of methods
Changing an object reads verb first, with the object as the first argument:
if bar.isLast
    zone = draw.box(time[10], high[10], time, low[10], color = lime)
    draw.setText(zone, "Demand, 10 bars old")
    draw.setColor(zone, teal)
    draw.setFillColor(zone, fade(teal, 85))
There is no zone.setText(...). The dot in draw.setText is not a method call: draw is a namespace and setText is a name inside it, exactly as math.pi and session.isFirstBar are names inside theirs. The language has one meaning for a.b, "the member b of the namespace a", so method syntax on a handle is error OS2001:
zone = draw.box(time[10], high[10], time, low[10])
zone.setText("Demand")
Version 1 has nothing a method could be built from: no type, so a value has no fields, and no function values, so nothing can be attached to a value. Verb-first calls also put the interesting word at the start of the line, which is what you scan for when reading somebody else's study.
Every change call
| Call | Applies to | Does |
|---|---|---|
draw.setFrom() | line, box | Moves the first anchor |
draw.setTo() | line, box | Moves the second anchor |
draw.setBounds() | line, box | Moves both anchors in one call |
draw.setAt() | label | Moves a label |
draw.setPoints() | polyline | Replaces the path |
draw.setText() | label, box | Changes the text |
draw.setColor() | line, label, box, polyline | Changes the line or border colour |
draw.setTextColor() | label, box | Changes the text colour |
draw.setFillColor() | box, polyline | Changes the fill |
draw.setWidth() | line, box, polyline | Changes the thickness |
draw.setStyle() | line | "solid", "dashed" or "dotted" |
draw.setExtend() | line | Continues the line to the edge of the pane |
draw.setTooltip() | label, box | Text shown while the pointer rests on it |
draw.delete() | line, label, box, polyline | Removes one object |
draw.deleteAll() | all | Removes every object this script created |
draw.count() | none | How many objects the script holds now |
Every one of these may appear anywhere: inside an if, inside a loop, inside a function. They are per-bar events, not declarations.
The "applies to" column is checked. An object kind is on the list when its creation call takes that property: only a line has a style, only a label and a box take a tooltip, only a line and a box have a second anchor. Passing another kind is error OS3011 at that argument, so a call that would have drawn nothing is caught before the script runs:
tag = draw.label(time, close, "Close")
draw.setStyle(tag, "dashed")
Handles
A creation call returns a handle, and the handle is an ordinary value: it can be assigned, kept in a var, pushed into an array and passed to a function. That is what lets a script come back to an object on a later bar.
| Handle | Made by | Lives | Notes |
|---|---|---|---|
line, label, box, polyline | The draw calls | Until you delete it | An ordinary value: store it, pass it, keep it in an array |
plot | plot() | The whole run | Fixed at compile time. It exists so fill() can name two plots, and cannot be stored in a var |
table | table() | The whole run | Declared at the top level like a plot; cell() names it |
The absent value is the natural "no object yet" for a drawing handle, and isNone() is the test. Starting a handle at none gives it its type from the first assignment. A plot handle is not a value that changes per bar, so putting one in a var is error OS2003:
p = plot(close, "Close")
var kept = p
Lifetime
An object lasts until the script deletes it: not until the next bar, not until the chart scrolls. A script may hold a limited number at once (10,000 by default), and a script that would go past the limit stops with error OS5010 rather than having its oldest drawing quietly dropped. A silent drop would give a study that is right on a short chart and wrong on a long one, in a way the source does not show. The cost of that choice is that housekeeping is your job, which is what the rest of this page is about.
One piece of housekeeping is done for you. The newest bar of a chart receiving real-time updates is executed again on every update, and the rollback rule restores the set of objects to what it was at the end of the previous bar before each re-execution. So a script that creates one line per bar creates one per bar, not one per update. Realtime and confirmation covers the rule.
A capped set of objects
When a study draws one object per event, the script owns the cap. An array of handles and one trim is the whole pattern:
version 1
study("Breakout rays", overlay = true, precision = 2)

len  = input(20, "Lookback", min = 2, max = 500)
keep = input(5, "Rays kept", min = 1, max = 50)

// The prior window's high, read one bar back so this bar's own high
// cannot be part of the level it is breaking.
priorHigh = highest(high, len)[1]
broke = close > priorHigh

// An array of handles. Its element type comes from the first push.
var rays = []

if broke
    ray = draw.line(time, priorHigh, time, priorHigh, aqua, 1)
    draw.setExtend(ray, false, true)
    push(rays, ray)

// Oldest first, because shift takes from the front. Deleting the object and
// removing its handle happen in one statement, so they cannot drift apart.
while size(rays) > keep
    draw.delete(shift(rays))

plot(priorHigh, "Prior high", gray, style = "step")
Two details make this safe. The trim is a while loop outside the if, so it enforces the cap on every bar however the array grew, rather than trusting that each push added exactly one handle. And draw.delete(shift(rays)) deletes exactly the handle it removes, which is the shape to copy: a delete in one place and a removal in another is how a script ends up holding handles to objects that are gone.
Deleting, and the stale handle
A handle outlives its object. Deleting the object does not clear the variable, and using a handle after its object is gone is error OS4005, with a message naming the bar the object was deleted on. The script stops on that bar.
Here is the pattern, complete, with the guard in place. It keeps one demand zone from the latest swing low, stretches it right while it holds, and removes it when price closes below it:
version 1
study("One demand zone", overlay = true, precision = 2)

leftBars  = input(5, "Pivot left bars", min = 1, max = 50)
rightBars = input(5, "Pivot right bars", min = 1, max = 50)

// A pivot is reported rightBars bars after the bar it formed on, the first
// bar on which it could honestly be known.
pivot = pivotLow(low, leftBars, rightBars)

var zone       = none
var zoneBottom = none

// A new pivot replaces the old zone. Nothing deletes the old object for you,
// so the script does it before overwriting the handle.
if not isNone(pivot)
    if not isNone(zone)
        draw.delete(zone)
    zoneTop    = min(open[rightBars], close[rightBars])
    zoneBottom = low[rightBars]
    zone = draw.box(time[rightBars], zoneTop, time, zoneBottom,
                    color = lime, fillColor = fade(lime, 85), text = "Demand")

// Price closed through it, so the zone is finished. Delete the object and
// forget the handle in the same block.
if not isNone(zone) and close < zoneBottom
    draw.delete(zone)
    zone = none
    zoneBottom = none

// Still alive: stretch its right edge to this bar. setTo moves the second
// anchor only, so the left edge stays where the pivot put it.
if not isNone(zone)
    draw.setTo(zone, time, zoneBottom)
The supply and demand study in Example scripts applies the same pattern to many zones at once, on both sides of price:
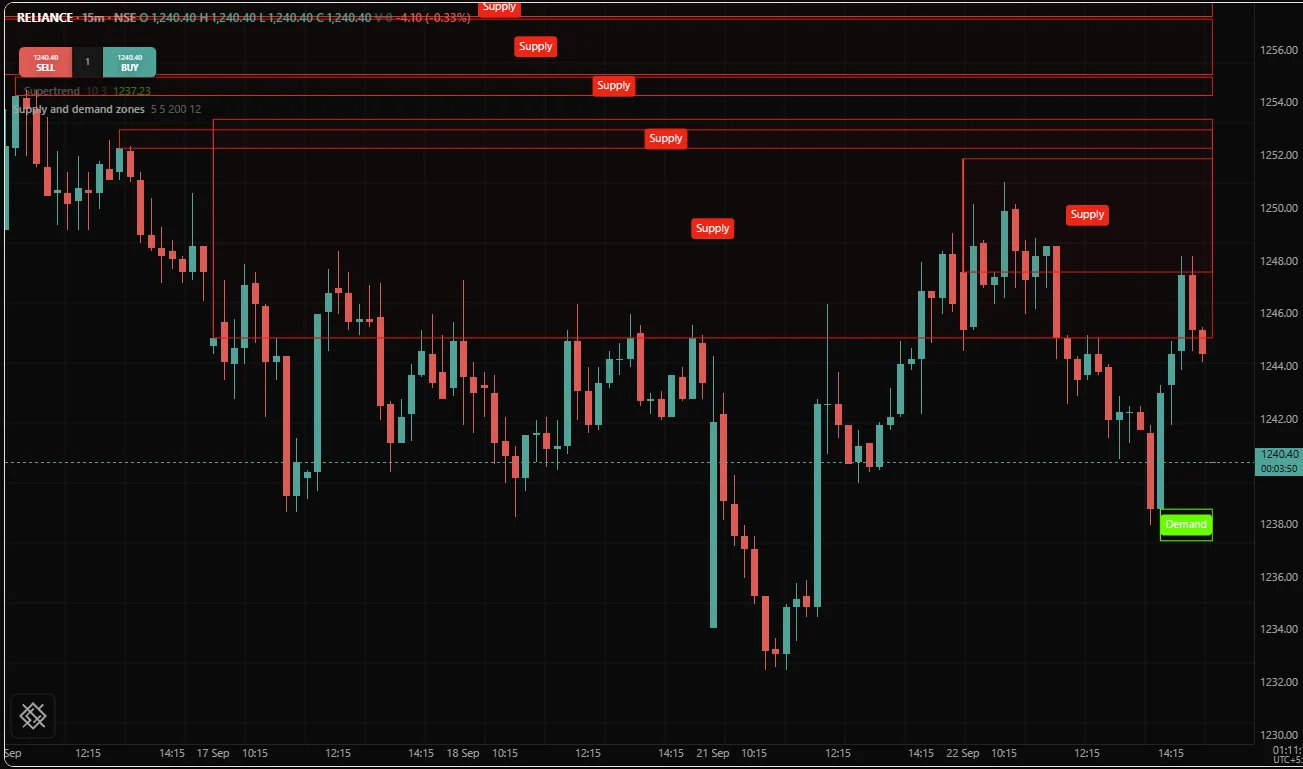
Take out the two lines that set zone and zoneBottom back to none and the study still compiles, draws correctly for a while, and then stops with OS4005 on the first bar a zone is broken, because draw.setTo() is handed a box that no longer exists.
That is an error rather than a call that quietly does nothing because a script changing a deleted object has lost track of its own state, and it will keep losing track. The silent version of this bug is a study that appears to work while half its drawing calls land nowhere.
| Wrong | Right |
|---|---|
draw.delete(zone) and leave zone holding the handle | draw.delete(zone), then zone = none |
| Guard with a separate bool that can drift out of step | Guard with isNone(zone) |
| Delete in one branch and clear the handle in another | Do both in the same block |
When to delete
| Situation | Do |
|---|---|
| The object describes a condition that has ended | Delete it on the bar the condition ends, and clear the handle |
| The object is old enough to be noise | Keep its creation time beside the handle and delete on age |
| The study draws one object per event | Cap the count and delete oldest first |
| The whole picture depends only on the current state | draw.deleteAll() and redraw, but only when bar.isLast is true |
| Every object is the study's output and still means something | Keep it, and say so in a comment |
draw.deleteAll() followed by a redraw is the simplest correct approach when a study shows the present state rather than a history, but doing it on every bar means rebuilding the picture on every bar of the chart to display the last one. Guard it with bar.isLast and the cost disappears.
While you develop a drawing-heavy study, put draw.count() in a table cell. A number that climbs forever is the symptom of every bug on this page.
Objects cannot be read back
An object can be written to and deleted. There is no call that asks a box where its edges are, or a label what its text says. So a script that needs to reason about what it drew has to remember it: an array of handles, and one array per fact about them, all indexed together.
var zones:      array<box> = []
var zoneTop:    array<number> = []
var zoneBottom: array<number> = []
var zoneTime:   array<number> = []

if bar.isConfirmed and close > open and close[1] < open[1]
    push(zones, draw.box(time[1], high[1], time, low[1], color = teal))
    push(zoneTop, high[1])
    push(zoneBottom, low[1])
    push(zoneTime, time[1])

// Drop the oldest record from all four arrays together.
if size(zones) > 20
    draw.delete(shift(zones))
    shift(zoneTop)
    shift(zoneBottom)
    shift(zoneTime)

plot(size(zones), "Zones held")
That is the parallel array technique from Collections, and here it is not a style choice but the only option. Plan for two consequences: a removal loop over these arrays must count downwards, so removing one record cannot renumber a record the loop has yet to visit, and every add and every remove must touch all the arrays in the same block. The complete supply and demand example in Example scripts does exactly this over hundreds of bars.
Objects being write-only is a known gap rather than a settled design. Write scripts so the answer does not matter: keep the facts you need in your own arrays, and treat the object as a picture of them.
Tables
A table is the other object a script creates, and it behaves differently on purpose. It is declared at the top level, before bar 0, like a plot, because the pane has to know what it is reserving room for:
version 1
study("Session panel", overlay = true, precision = 2)

panel = table("Session", 3, 2, position = "topRight", textColor = silver)

spread = atr(14)

// The session's first bar, or of the IST day where the host states no
// session hours, as on the /trading chart.
newSession = orElse(session.isFirstBar, isNone(time[1]) or not date.isSameDay(time, time[1], "Asia/Kolkata"))

// Bars since the session opened, counted with a var that restarts each session.
var sessionBars = 0
sessionBars = newSession ? 1 : sessionBars + 1

// Written only on the newest bar. The panel shows one state, the current one,
// so writing it on every bar would be work thrown away on every bar but the last.
if bar.isLast
    cell(panel, 0, 0, "Symbol")
    cell(panel, 0, 1, chart.symbol, textColor = white)
    cell(panel, 1, 0, "ATR 14")
    cell(panel, 1, 1, isNone(spread) ? "warming up" : text(spread, 2))
    cell(panel, 2, 0, "Bars this session")
    cell(panel, 2, 1, text(sessionBars))
The dashboard in Example scripts is built the same way, with more rows, and also writes only on the newest bar:
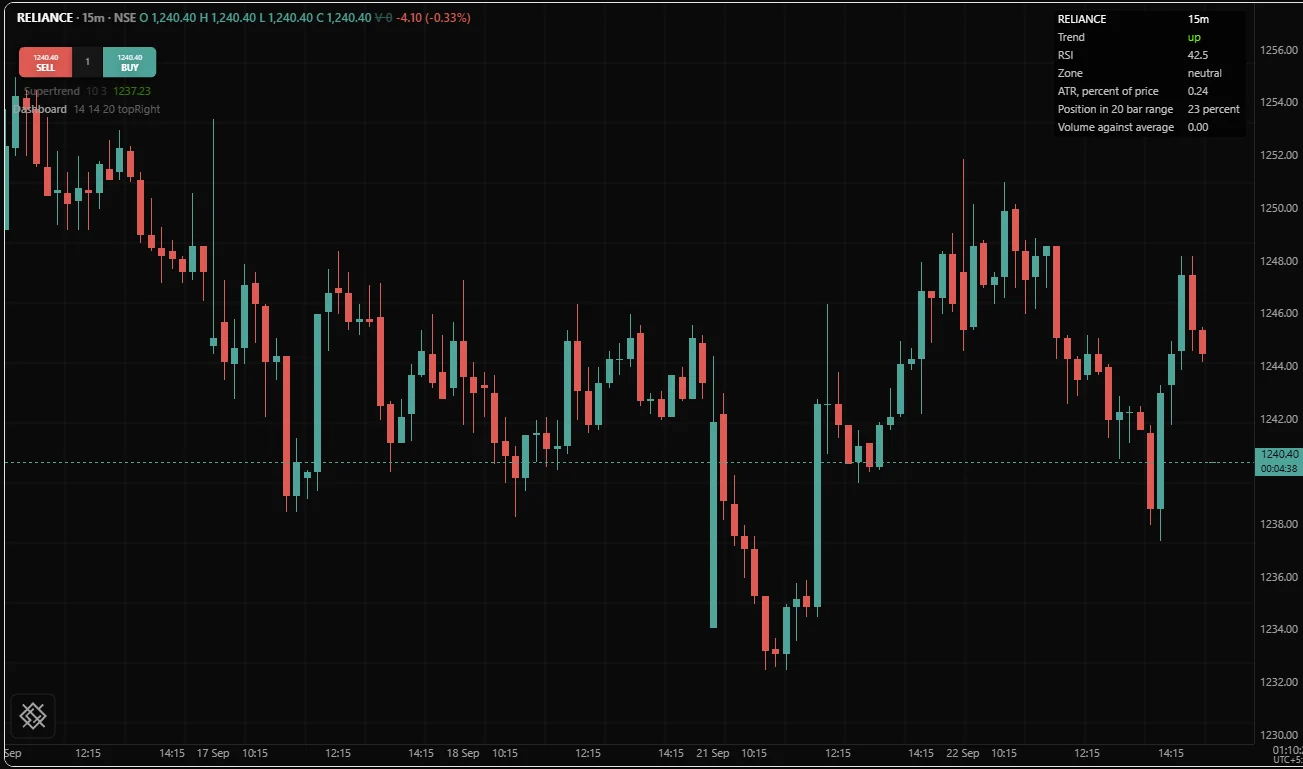
table() is top level only, for the same reason plot() is. cell() and clear(panel) may appear anywhere, and clear empties every cell so a table can be rebuilt from scratch. There is no draw.delete for a table: it is a fixed part of the study, like a plot, and lives as long as the study does. A cell outside the declared rows and columns stops the script; in this release it raises OS4004, naming the index, while the more specific OS4008 in the error list is not raised yet. Tables covers layout and styling.
Errors you will meet
| Code | Means | Usual fix |
|---|---|---|
| OS4005 | A change call was given an object that was deleted | Set the handle to none when you delete, and guard with isNone |
| OS3011 | A change call was given the wrong kind of object | Check the "applies to" column above |
| OS3006 | plot, fill, level or table inside a block | Move it to the top level; hide a plot by plotting none |
| OS4004 | A cell outside the table, or an index outside an array of handles | Declare enough rows and columns, or check the index |
| OS5010 | More objects than a script may hold | Cap the set and delete as you drop handles |
| OS2001 | Method syntax such as zone.setText(...) | Write draw.setText(zone, ...) |
User types and methods: what is planned
type is reserved in version 1 for user-declared record types and the field access that goes with them. When it arrives it is meant to replace the parallel arrays above with one array of records, and to give draw.polyline a natural array of points. Until then, the parallel array shape is the way to keep several facts per object. The exact spelling of records, and whether handles gain any method-style calls, will be settled with that language version; nothing in this release depends on it, and a script that compiles under version 1 keeps compiling and keeps drawing the same thing afterwards.
Related. Collections, Realtime and confirmation, User functions, Libraries, Lines and boxes, Labels and shapes, Drawing objects reference