
Higher timeframes
Reading a daily, weekly or hourly value on an intraday chart with req.timeframe, and choosing the mode that decides whether the study can repaint.
On this page
A five minute chart of an NSE stock knows nothing about yesterday's high as a single number, or about the trend on the daily chart. req.timeframe() gives a script those answers: it computes an expression on coarser bars and hands the result back on every bar of the chart. This page covers how that works in OpenScript (also called OpenAlgo Script), the rules the timeframe must follow, and the one argument that matters most, mode, which decides whether the study can ever show you something that was not knowable at the time.
Most of what people want from a higher timeframe is yesterday's numbers, so here is that first:
version 1

study("Previous day levels", overlay = true, precision = 2)

// Each read is one daily series. The default mode, "confirmed", reads only
// days that have closed, so on every bar of today these are yesterday's.
prevHigh  = req.timeframe("1D", high)
prevLow   = req.timeframe("1D", low)
prevClose = req.timeframe("1D", close)

// Arithmetic on reads you already have costs nothing. A fourth read would.
prevMid = (prevHigh + prevLow) / 2

prevHighPlot = plot(prevHigh,  "Previous high",  aqua,   width = 2, style = "step")
prevLowPlot  = plot(prevLow,   "Previous low",   orange, width = 2, style = "step")
plot(prevClose, "Previous close", silver, style = "step")
plot(prevMid,   "Previous mid",   fade(silver, 50), style = "step")
fill(prevHighPlot, prevLowPlot, fade(aqua, 94))
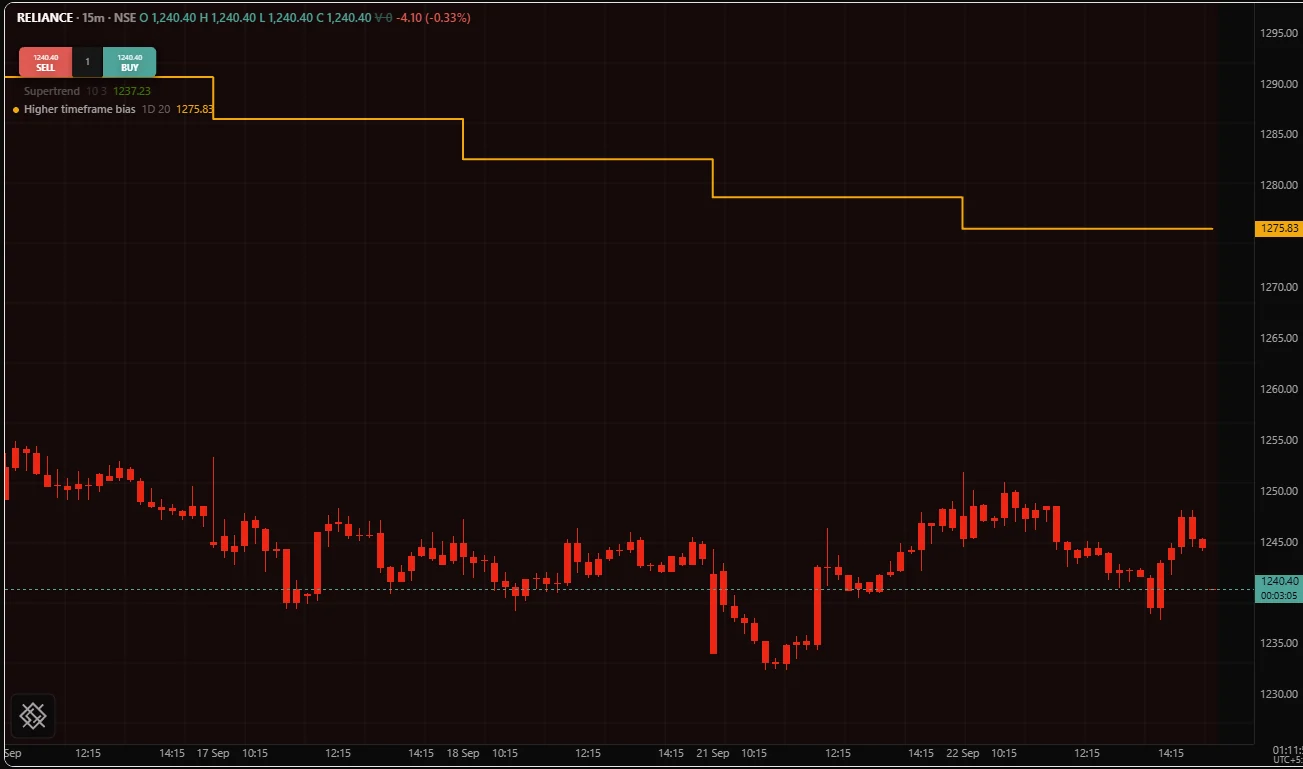
Put it on an intraday chart and the four levels step once a day, at the first bar of each session. No [1] is needed inside the read: a confirmed daily read already is the last day that closed.
What folding means
A study on a five minute chart runs once per five minute bar. A daily value has no five minute counterpart, so asking for one is two questions:
- Compute this expression on daily bars.
- Give me the answer that was available on each five minute bar.
req.timeframe answers both. It groups the chart's bars into coarse bars, computes the expression over those coarse bars, and samples the result back onto the chart, one value per chart bar. The grouping is called the fold, and it is why a coarse intraday interval has to be a whole multiple of the chart's: the engine counts chart bars into each coarse bar, and a coarse bar that ended halfway through a chart bar could not be counted.
| Argument | Type | Means |
|---|---|---|
timeframe | string | The coarse interval, written as on Timeframes |
expr | any | The expression to compute on the coarse bars |
mode | string | "confirmed" (the default), "developing" or "lookahead". See the mode |
The call returns a series of whatever expr produces: a number for a price or an average, a bool for a comparison, a string for a formatted label.
Rules for the timeframe
| Rule | What happens when it is broken |
|---|---|
| The timeframe must be a form the language knows | OS6001, from the compiler for a literal, or when the study loads for a value from an input |
| It must not be finer than the chart's interval | OS6002 when the study loads, naming both intervals |
| An intraday timeframe must be a whole multiple of the chart's | OS6015 when the study loads, suggesting an interval that works |
| Day, week and month timeframes are folded by the calendar | They are exempt from the multiple rule |
| The timeframe is fixed before the first bar | OS3003 from the compiler when it depends on bar data |
OS6002 is worth understanding rather than memorising. Folding a finer interval into a coarser bar needs data from inside that bar, and the chart was never given it. An engine that filled the gap would be inventing prices, so the request is refused. If you need five minute detail, put the chart on five minutes and fold upward.
The timeframe is fixed before the first bar because the engine sets up each read once and keeps it in step with the chart. So a timeframe comes from a literal or an input(), never from the bar's data:
// Refused: the timeframe depends on this bar's prices.
tf = close > open ? "1h" : "1D"
h = req.timeframe(tf, high)
plot(h, "Coarse high")
// Correct: the reader picks the timeframe once, before the first bar.
tf = input("1h", "Higher timeframe", kind = "interval")
h = req.timeframe(tf, high)
plot(h, "Coarse high")What the expression means inside a read
expr is compiled as a separate program over the coarse bars. Inside it, open, high, low, close, volume and time belong to the coarse bars, and every library call reads coarse bars.
dayHigh   = req.timeframe("1D", high)              // yesterday's high
dayTrend  = req.timeframe("1D", ema(close, 20))    // a 20 day EMA of daily closes
dayStrong = req.timeframe("1D", close > open)      // a bool, folded
plot(dayHigh, "Yesterday's high", style = "step")
plot(dayTrend, "Daily EMA 20")
background(dayStrong ? fade(lime, 95) : none)
req.timeframe("1D", ema(close, 20)) is a twenty day average of daily closes, sampled onto every bar of the chart. It is not ema(close, 20) computed on the chart's own bars, and it is not close to it. That difference is the whole reason to make the read.
Three restrictions apply inside expr:
- A name from the rest of the file may be read only when it is fixed before the first bar: a literal, arithmetic over literals, or an
input(). A value computed on this chart's bars has no counterpart on the coarse bars, so reading one is OS6003. Avarthat starts from an input counts as a per-bar name, because a later line may change it. - An
input()may be written insideexpritself. It is the same setting and the same row of the settings dialog as it would be behind a name. - Orders, markers, drawings and alerts do not belong inside
expr. An order function there is OS7003 and a drawing or alert call is OS3006. The expression is a calculation over other bars, not a second script with effects of its own.
len = input(20, "Length", min = 2, max = 500)
trendUp = req.timeframe("1D", ema(close, len) > ema(close, len * 2))
sameIdea = req.timeframe("1D", ema(close, input(50, "Coarse length", min = 2)))
plot(sameIdea, "Daily EMA")
bgUp = trendUp ? fade(lime, 94) : none
background(bgUp)
atrNow = atr(14)
// Refused: atrNow is computed on this chart's bars.
wide = req.timeframe("1D", high - low > atrNow)
plot(wide ? 1 : 0, "Wide day")History inside the read and outside it
This is the most common mistake with a coarse read, and the rule is one sentence: [] inside expr counts coarse bars, and [] on the result counts chart bars.
| Expression | Counts | On a 5 minute chart at 11:20 it holds |
|---|---|---|
req.timeframe("1D", high) | Days | Yesterday's high, the last day that closed |
req.timeframe("1D", high[1]) | Days | The high of the day before yesterday |
req.timeframe("1D", high, mode = "developing") | Days | Today's high so far |
req.timeframe("1D", high)[1] | Chart bars | What the read held at 11:15, which is yesterday's high again |
Read the first row twice before writing [1] inside a read. A confirmed read is already one day back, so high[1] inside it is two days back. A script that wrote it meaning "yesterday" would draw a level from the wrong session and never look wrong.
The mode
A coarse bar takes many chart bars to form. On any chart bar inside it, there are exactly three things a read can hand back, and mode names which one.
| Mode | Reads | On a forming coarse bar it returns | Can repaint | First value |
|---|---|---|---|---|
"confirmed" | Only coarse bars that have closed | The last closed coarse bar's value, held until the next one closes | Never | Once the first coarse bar has closed |
"developing" | The coarse bar that is forming | The value so far of the coarse bar this chart bar is inside | On the newest bars, while the coarse bar forms | Once the first coarse bar has begun |
"lookahead" | The coarse bar's final value | The final value of the coarse bar this chart bar is inside, even on its first chart bar | On history, permanently | Wherever the coarse bar exists |
"confirmed" is the default and the only mode that never repaints. The other two must be written out, so a script that can repaint says so on the line that causes it, in a word a reviewer sees, and a script that says nothing cannot repaint this way.
The compiler warns about a "lookahead" read with OS8005. A "developing" read carries no warning: the mode word on the line is its disclosure, which is why it has to be written. The compiled study records the mode of every read, so a host can mark a lookahead study as repainting; the /trading legend does not show such a mark today, so the warning and the word in the source are the disclosure. Repainting covers the whole subject.
The same hour, read three ways
Take a five minute NSE chart and an hourly read. On an IST chart an hourly read runs from 10:30 to 11:30 (why). Say that hour opens at 100.0, works up to 104.0 and closes there, and the hour before it closed at 101.0.
| Chart bar | "confirmed" | "developing" | "lookahead" |
|---|---|---|---|
| 10:30 | 101.0 | 100.2 | 104.0 |
| 10:45 | 101.0 | 100.9 | 104.0 |
| 11:00 | 101.0 | 102.4 | 104.0 |
| 11:25 | 101.0 | 103.8 | 104.0 |
| 11:30 | 104.0 | the next hour so far | the next hour's close |
Read the columns, not the rows.
- Confirmed is flat for the whole hour and steps once, at 11:30, to the value the 10:30 hour finished at. Everything it shows at 11:00 was knowable at 11:00. It is one hour behind by construction, and that lag is the price of never being wrong about the past.
- Developing moves with the market. At 11:00 it says what the hour has done so far, which is true and useful. It is also a statement about an hour that has not finished: the 11:00 value is not the hour's result, it changes with every price update while the newest bar forms, and a signal built on it at 11:00 can be contradicted by the time the hour closes.
- Lookahead shows 104.0 at 10:30, which nobody could have known at 10:30. On a historical chart this column looks brilliant: every breakout is anticipated. It is the shape of a study that looks perfect on history and loses money when traded.
The three modes in one script
Put them on a chart together once, and the difference stops being abstract. The compiler warns about the lookahead read, which is the point of this study.
version 1

study("Three readings of one hour", overlay = true, precision = 2)

tf = input("1h", "Coarse interval", kind = "interval")

// Three reads of the same expression, for the comparison. A working study
// makes one read and reuses the name.
confirmed  = req.timeframe(tf, close, mode = "confirmed")
developing = req.timeframe(tf, close, mode = "developing")
lookahead  = req.timeframe(tf, close, mode = "lookahead")

confirmedPlot = plot(confirmed, "Confirmed", aqua, width = 2, style = "step")
plot(developing, "Developing", orange, width = 2, style = "step")
lookaheadPlot = plot(lookahead, "Lookahead", red, width = 2, style = "step")

// The shaded gap is how much this study would be cheating if it traded from
// the red line.
fill(lookaheadPlot, confirmedPlot, fade(red, 90))
When each mode is the right answer
| You want | Mode | Because |
|---|---|---|
| A trend filter a strategy trades from | "confirmed" | Only a closed bar is a fact, and the backtest must match what trading would have done |
| The day's range so far, on a dashboard | "developing" | A person is reading it, not trading it, and "so far" is the question |
| A finished coarse candle drawn across history, as a picture | "lookahead" | The picture is the point, and nothing trades from it |
| Yesterday's high as a level | "confirmed", the default | It is the last day that closed, and nothing about a closed day can change |
The mode is written as a literal. A mode taken from an input is refused by the compiler with OS3003, because a setting would let a reader change the honesty of a study without reading a line of it.
Where the coarse bars begin
Day, week and month reads follow the calendar in the chart's timezone. A "1D" read groups each trading day, which on NSE, BSE and MCX is one session, because none of their sessions runs past midnight IST. A "1W" week starts on Monday. A "1M" month is the calendar month.
Intraday reads count fixed periods from midnight UTC, which is 05:30 IST. That has a visible effect on an Indian chart:
| Read | Coarse bars on an NSE chart |
|---|---|
"15m" | 09:15 to 09:30, 09:30 to 09:45, and so on, lined up with the open |
"30m" | 09:30 to 10:00, 10:00 to 10:30, and so on, with 09:15 to 09:30 as a short first bar |
"1h" | 09:30 to 10:30, 10:30 to 11:30, and so on, with 09:15 to 09:30 as a short first hour |
So a "30m" or "1h" read does not start its first coarse bar at the 09:15 open, and the first one of each day covers only fifteen minutes. A study that needs coarse bars lined up with the open, such as the first half hour's range, is better written with a time window on the chart's own bars.
A period that divides 24 hours evenly, such as 15, 30, 60 or 120 minutes, falls at the same clock times every day. One that does not, such as 75 minutes, falls at different times from one day to the next, so prefer periods that divide the day.
Warmup and the left edge
A confirmed read is absent until the first coarse bar has closed. On a five minute chart with a "1D" read, that is the whole of the first day on the chart: the first value appears at the open of the second. If the coarse expression has a warmup of its own, add it. req.timeframe("1D", ema(close, 20)) needs twenty closed days, so on an intraday chart the line starts about a month in. On the /trading chart, scrolling back past the loaded range loads older bars, which is how you give a long daily warmup enough history.
Absence propagates, so write a comparison against a read so that warmup is handled on purpose rather than by accident:
bias = req.timeframe("1D", ema(close, 20))

// close > bias is absent during warmup, not false. Test for it, so that "up"
// and "down" are both false while the read has no value yet.
up   = not isNone(bias) and close > bias
down = not isNone(bias) and close < bias
barColor(up ? lime : down ? red : none)
A working example: a daily bias on an intraday chart
version 1

study("Higher timeframe bias", overlay = true, precision = 2)

biasTf  = input("1D", "Bias interval", kind = "interval")
biasLen = input(20,   "Bias average length", min = 2, max = 500)
paint   = input(false, "Recolour the candles")

// The mode is a literal on purpose: an input would let a reader change the
// honesty of the study from the settings dialog.
biasClose   = req.timeframe(biasTf, close, mode = "confirmed")
biasAverage = req.timeframe(biasTf, ema(close, biasLen), mode = "confirmed")

up   = not isNone(biasAverage) and biasClose > biasAverage
down = not isNone(biasAverage) and biasClose < biasAverage

plot(biasAverage, "Bias average", orange, width = 2, style = "step")

barColor(paint ? (up ? lime : down ? red : none) : none)
background(up ? fade(lime, 95) : down ? fade(red, 95) : none)

// orElse on the previous bar, because on bar 0 there is no previous bar, and
// an absent condition would leave the very first flip unmarked.
if up and not orElse(up[1], false)
    signal("BIAS UP")

if down and not orElse(down[1], false)
    signal("BIAS DOWN")
The file does not set onUnconfirmed, so each marker waits for its chart bar to close. The next section says why that matters here.
Reads and the moving bar
By default, a signal(), an alert() or an order does not fire on a chart bar that is still moving. It waits until the bar closes, and if the condition is no longer true by then it never happens. A study or strategy opts out with onUnconfirmed = true, and when it does, the compiler warns about every read in the file, of another interval or another instrument, with OS8002, whatever the read's mode:
version 1

study("Unguarded bias", overlay = true, onUnconfirmed = true)

dayHigh = req.timeframe("1D", high)
plot(dayHigh, "Previous high", aqua, style = "step")

if crossUp(close, dayHigh)
    signal("ABOVE YESTERDAY")
The reason is stacked uncertainty. The chart bar is still moving, so its own close will change, and acting on it and a coarse read together means acting on values that can each still be withdrawn. Drop onUnconfirmed = true, or guard every use of the read with bar.isConfirmed.
The cost of a read
Each read is one folded series the engine builds from the chart's bars and keeps in step with them.
- A host may set a ceiling on reads per file. Going over it is OS5006, which names how many the file makes and how many are allowed. The /trading chart sets no ceiling today, but the habit that keeps you under one is worth having anyway: make one read per timeframe and expression, assign it to a name, and reuse the name.
- Arithmetic on reads you already have is cheap. A study that makes three reads and does arithmetic on them is cheap. A study that makes thirty is one to rewrite.
Drawing a coarse bar as a candle currently takes four reads, one per price. A single call that returns the whole coarse bar, req.candle(), is planned for exactly this reason.
Higher timeframes in /trading
| Where the script runs | Intraday reads such as "15m" or "1h" | Day, week and month reads |
|---|---|---|
| On the chart, as a study | Folded from the chart's own bars | Folded in the chart's timezone, Asia/Kolkata unless you changed it in the chart settings |
| In the Backtest panel | Folded from the chart's bars | Absent on every bar, because the backtest run is not told the chart's timezone |
The rules for the timeframe need the chart's interval. /trading names its daily, weekly and monthly charts D, W and M, which the language cannot read, so on those charts OS6002 and OS6015 are never raised. A "1h" read on a /trading daily chart is not refused: every day becomes its own coarse bar, and the read quietly hands back the previous day's value. On a daily chart, read only "1D" or coarser.
Related: Timeframes, Repainting, Other instruments, Sessions and time, req.* reference, Warmup