
Execution model
A script runs once per bar, top to bottom, oldest bar first. What that means for every line you write, from what is recomputed to what is remembered and what reaches the chart.
On this page
- The file is the body of a loop
- Compiled once, run once per bar
- Bars and the bar facts
- Recomputed, remembered, fixed
- Five bars, line by line
- Source order is execution order
- Blocks run inside the bar
- A call keeps state, per call site
- Loops run inside one bar
- The newest bar runs more than once
- Same bars, same numbers
- What reaches the chart
- Four mistakes this model causes
An OpenScript file has no main function, no event handler and no entry point. The file itself is the body of a loop that the engine (the part of OpenScript that runs a compiled script) runs over every bar of the chart, oldest first. This page explains that loop: what is computed afresh on every bar, what is carried forward, what is fixed before the first bar, and what the chart receives at the end. Almost every surprise in a per-bar language is a surprise about when something runs, so the rest of the documentation leans on this page.
The file is the body of a loop
for each bar in the data, oldest first:
    run every top-level statement of the file, first line to last
That is the whole model. A file of forty lines is forty statements the engine runs for bar 0, again for bar 1, again for bar 2, all the way to the newest bar, and then again on the newest bar each time it updates.
version 1
study("Trace")

n = bar.index
plot(n, "Bar index")
On a 5-minute chart of an NSE stock, one session from 09:15 to 15:30 IST is 75 bars, and a year of sessions is about eighteen thousand. The line n = bar.index runs once for each of them. You never write this loop and you cannot see it: it is the shape of the language.
Compiled once, run once per bar
Two things happen at two different times.
source text
   -> checked by the compiler -> compiled program      once, before bar 0
   -> for each bar: run the program top to bottom      once per bar
Compilation happens once. Names are resolved, types are checked, the set of plotted columns is fixed, the settings dialog is built from the input() calls, and the whole script becomes a compiled program: plain data, a list of instructions the engine walks.
Execution happens once per bar. Every instruction runs again for every bar.
A few calls live in both worlds. plot(), plotCandles(), fill(), level(), table() and input() declare the fixed shape of the study: how many columns it has, what they are called, what the legend shows and which rows the settings dialog has. That shape is read once, when the script is compiled. Their arguments are still evaluated on every bar, which is how one plot statement produces one value per bar.
This is why those calls must sit at the top level of the file, outside every block. A plot, plotCandles, fill, level or table inside an if is error OS3006, and an input() inside a block is OS3007, because the chart cannot build a legend for a column that might not exist:
trending = ema(close, 20) > ema(close, 50)
if trending
    plot(ema(close, 20), "EMA 20", aqua)
The fix is always the same: keep the plot at the top level and plot the absent value none on the bars you want hidden. An absent value on a plot is a gap in the line, never a zero.
version 1
study("EMA while trending", overlay = true)

ema20 = ema(close, 20)
trending = ema20 > ema(close, 50)

plot(trending ? ema20 : none, "EMA 20", aqua)
Everything else may appear inside any block: signal(), alert(), background(), barColor(), cell(), print(), the draw.* functions and every order function. They are per-bar events or per-bar paint, so they belong inside the per-bar logic.
Bars and the bar facts
bar.index is the zero-based position of the bar being run within the data the engine was given. The oldest bar loaded is 0. The bar namespace holds the other facts about the current bar:
| Name | Type | Means |
|---|---|---|
bar.index | series number | Position of this bar, the oldest is 0 |
bar.count | series number | bar.index + 1, the bars seen so far |
bar.isFirst | series bool | bar.index == 0 |
bar.isLast | series bool | This is the newest bar in the data |
bar.isConfirmed | series bool | This bar's interval has elapsed |
bar.isRealtime | series bool | Real-time updates are driving this bar |
bar.isNew | series bool | The last update added a bar rather than replacing one |
bar.updates | series number | How many times this bar has been run, counting from 1 |
A bar index is a position in the data you loaded, not a permanent address for a moment in market history. Scroll far enough left and the chart loads older bars: every index then shifts by the number of bars that arrived. Subtracting two indices from the same run is safe, because both come from the same numbering, but storing an index and comparing it later is not. Store time for anything that has to survive more history arriving: a bar's opening instant does not move. That is also why the draw.* objects are anchored to a time and a price rather than to an index.
version 1
study("Minutes since the highest high", precision = 0)

var peak = none
var peakTime = none

if isNone(peak) or high > peak
    peak = high
    peakTime = time

// time is milliseconds since 1970 in UTC, so a difference is milliseconds.
plot((time - peakTime) / 60000, "Minutes since the highest high", aqua)
Recomputed, remembered, fixed
Every name in a script has one of these lifetimes:
| Name | Lives for | Set by | Readable with [] |
|---|---|---|---|
| A plain top-level name | One bar | Its assignment, on every bar | Yes |
| A name first assigned inside a block | One bar, inside that block only | Its assignment, on the bars the block runs | No, OS2004 |
A var | The whole run | Its initial value once, then any assignment | Yes, when it is at the top level |
A live var | The whole run, and it ignores rollback (below) | The same | Yes, when it is at the top level |
A name holding an input() | The whole run, one value | The settings dialog, before bar 0 | Yes, when it is at the top level |
A line with var on it is remembered. Every other assignment is recomputed from nothing on each bar. The previous value of a recomputed name is not lost, because the history operator [1] can read it, but it is not the starting point for this bar:
tally = tally + 1tally does not exist yet on this bar when the right-hand side is read, so this is error OS2001. Reading the previous bar instead compiles, and is absent for ever:
tally = 0
tally = tally[1] + 1  // absent on every bar
plot(tally, "Never draws")
On bar 0 there is no previous bar, so tally[1] is absent and the sum is absent. On bar 1 it reads bar 0's absent value, and so on. Keeping a running count is what var is for, and Persistence is the page about it.
Five bars, line by line
Here is a complete script, followed by every value it holds on its first five bars.
version 1
study("Up share", precision = 2)

// Recomputed from the bar's own data every bar.
delta = close - close[1]

// Remembered. The initial value is set once, on bar 0.
var up = 0

// An absent condition takes the false branch, which is what happens on bar 0.
if delta > 0
    up = up + 1

// Recomputed, but from a remembered value.
ratio = up / bar.count

plot(delta, "Change", aqua)
plot(ratio, "Up share", orange)
Given five bars that close at 100, 102, 101, 104 and 104:
| Bar | close | close[1] | delta | up entering | Branch | up leaving | bar.count | ratio |
|---|---|---|---|---|---|---|---|---|
| 0 | 100 | absent | absent | 0, just set | not taken | 0 | 1 | 0.00 |
| 1 | 102 | 100 | 2 | 0 | taken | 1 | 2 | 0.50 |
| 2 | 101 | 102 | -1 | 1 | not taken | 1 | 3 | 0.33 |
| 3 | 104 | 101 | 3 | 1 | taken | 2 | 4 | 0.50 |
| 4 | 104 | 104 | 0 | 2 | not taken | 2 | 5 | 0.40 |
Each column shows a rule rather than an accident:
- Bar 0 has no previous bar.
close[1]is absent, not 100 and not zero. Nothing is clamped to the start of history. See Bars and history. - Absence propagates through arithmetic. One absent operand makes
deltaabsent on bar 0, so the "Change" line starts at bar 1. - An absent condition takes the false branch. On bar 0,
delta > 0is itself absent, and theifskips its block because execution has to go somewhere. See Absent values. upis set exactly once. Thevarline is reached on every bar, but its initial value is applied only on the first bar that reaches it.deltais computed from scratch every bar;upis not. On bar 3,upenters holding 1 because bar 2 left it there.- Zero is not false. On bar 4 the change is exactly 0 and
0 > 0is false, so the branch is not taken. A condition is always a comparison or abool, never a number.
Source order is execution order
Inside the file, a name must be assigned on a line above the one that reads it. Reading it earlier is error OS2001, not an absent value:
plot(slow, "Slow", orange)
slow = ema(close, 21)
Functions are the exception. A function declaration is not a per-bar statement, and the compiler collects every declaration before it checks any body, so a fn may be called above the line that declares it:
plot(smoothed(close), "Smoothed", aqua)

fn smoothed(src) => sma(src, 9)
Order also decides what a var holds at a given line, and this is an idiom worth learning. A var read before the line that reassigns it still holds the previous bar's value:
version 1
study("Trailing stop", overlay = true, precision = 2)

raw = low - 2 * atr(14)

var trail = none

// At this line trail still holds what the previous bar left in it.
prevTrail = trail

// Ratchet up while the previous bar closed above the stop, and start again
// from raw once it closed below.
trail = close[1] > orElse(prevTrail, raw) ? max(raw, orElse(prevTrail, raw)) : raw

plot(trail, "Trailing stop", lime, width = 2)
That is how a trailing stop reads its own previous value. Moving the prevTrail line below the assignment would change the meaning of the script, and the compiler cannot warn about it, because both orders are legal and both are useful somewhere.
Blocks run inside the bar
A block is not a separate pass over the data. An if body is part of this bar's run, and it runs or does not run on this bar alone. The same holds for every for, while and switch.
Two scope rules keep this predictable. An assignment to a name that already exists outside the block updates that name. A name first assigned inside a block does not exist outside it. So you never have to ask which of two variables a line writes to, and a var or a function parameter that reuses a name from outside is error OS2002. Variables and scope covers both rules in full.
A call keeps state, per call site
Some library functions remember something between bars. ema() needs the previous bar's average to produce this bar's, and so do rma(), atr(), vwap(), cum() and every function that reads a window of past bars. The reference marks each of these "Keeps state".
State belongs to the call site, not to the function. A call site is one place in the source where a function is called. Two calls written in two places are two independent pieces of state, and that is what lets one helper be used twice:
version 1
study("Bars since", precision = 0)

fn barsSinceTrue(cond) =>
    var n = none
    if cond
        n = 0
    else if not isNone(n)
        n = n + 1
    n

sinceUp = barsSinceTrue(close > open)  // its own counter
sinceHigh = barsSinceTrue(high > high[1])  // a separate counter

plot(sinceUp, "Bars since an up close", aqua)
plot(sinceHigh, "Bars since a higher high", orange)
Three consequences follow:
- A call inside a loop is one call site, so every iteration shares its one piece of state. For state per iteration, keep an array and index it. The compiler warns about a stateful call inside a loop with OS8001.
- A function may not call itself, directly or through other functions. That is error OS2005; write a loop.
- A call site that does not run on a bar leaves its value absent for that bar, and its state does not advance.
The last rule is the one that bites. A stateful call inside a branch only advances on the bars the branch runs, so the average is built from a subset of bars that nobody meant. The compiler reports warning OS8001:
trending = close > ema(close, 50)
if trending
    e = ema(close, 20)  // OS8001: advances only on trending bars
    barColor(close > e ? lime : red)
Compute the value on every bar at the top level, and use the result inside the branch:
version 1
study("Colour while trending", overlay = true)

e = ema(close, 20)
trending = close > ema(close, 50)

if trending
    barColor(close > e ? lime : red)
Loops run inside one bar
for and while run to completion inside a single bar. A loop is not a way to move across bars: the bar loop already does that. A loop is for walking an array, or a fixed window of history within this bar.
version 1
study("Window mean, by hand", overlay = true, precision = 2)

len = input(20, "Length", min = 1, max = 500)

total = 0.0
for i = 0 to len - 1
    total += close[i]

plot(total / len, "Mean", aqua)
That script is correct, and sma() does the same work with a running total and an exact, documented warmup (the number of bars a function needs before it has a value; see Warmup). The loop version is also absent for the first len - 1 bars, because close[i] past the start of history is absent and absence propagates through +=.
Every loop iteration counts against a per-bar budget: 2,000,000 iterations summed over every loop run during one bar. Going over is error OS5001, which stops the script at that bar (in /trading a notice appears when the study is added, and the Objects panel shows its status as Error) rather than quietly leaving the loop with a plausible wrong number. The budget resets on every bar, so a long history is never itself a reason to fail, and a script that needs more raises it with limits(loops = ...) under its declaration. Control flow covers the loop forms and the budget.
The newest bar runs more than once
While the market is open, the newest bar is still forming. The engine runs your script on it again every time it updates, and bar.updates counts those runs. Two rules make this safe:
- Rollback. Before each rerun of the forming bar, every
var(and every array avarholds) is restored to what it held at the end of the previous bar. Running the forming bar ten times gives the same answer as running it once, so a counter counts bars, not updates, and a chart agrees with a backtest over the same data. Alive varopts out of rollback for the rare script that means to count updates. - Events wait for the close.
signal(),alert()and orders on a bar that is still forming are held until the bar is confirmed. If the condition is no longer true when the bar closes, they never happen. A declaration opts in to acting earlier withonUnconfirmed = true.
Realtime and confirmation covers the forming bar in full, and Persistence covers var and live var.
Same bars, same numbers
The same compiled program over the same bars produces the same output on every engine, every time. That promise is what makes a backtest comparable with the chart, and the chart comparable with the same strategy when it is deployed, whether in sandbox trading (analyzer mode in OpenAlgo) or with real orders. To keep it:
- All arithmetic is 64-bit floating point, rounded to nearest with ties to even, in the order the source writes it. No engine may reorder operations or fuse two of them into one.
- Arrays are walked in index order. There is no unordered collection.
- There is no randomness anywhere in the language, and no reading of the clock during a bar except through
chart.now(), whose value the application running the script supplies. - Upper and lower case conversion and month names do not depend on the machine's locale (its language and region settings).
If two runs of your script disagree, the data disagreed.
What reaches the chart
At the end of each bar the engine has one value for every plotted column, plus whatever markers, colours, table cells and drawings the bar asked for. The chart receives the study as one description: plotted columns, fills, levels, markers, the table, drawings, the pane background, bar colours, a fixed pane range and the settings.
Here is one such description drawn: a HalfTrend study on a BHEL 15 minute chart, which hands the chart four plotted columns (the trend level twice, once per direction, and a faint channel edge for each), two fills and a marker on each flip:
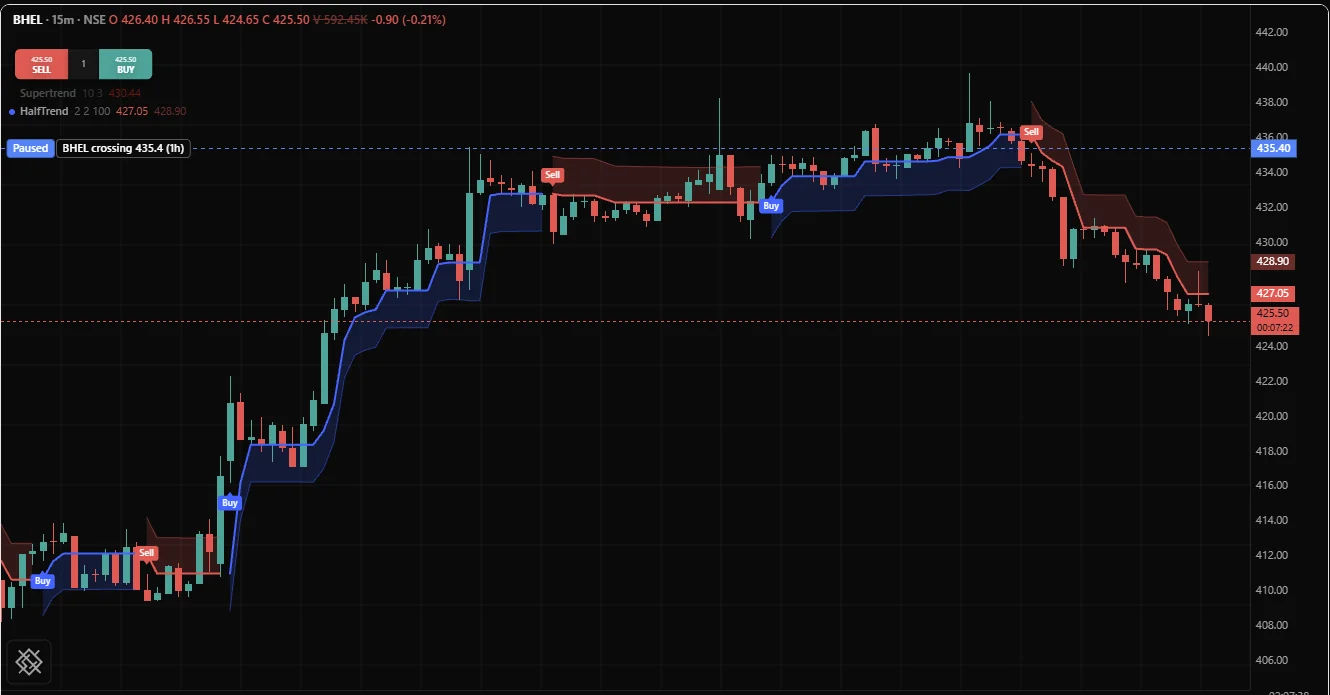
Two rules about that hand-off are worth carrying with you:
- An absent value is a gap, never a zero. A plot breaks its line, a fill stops, a bar colour leaves the bar its own colour, a table cell is blank.
- Signals, alerts and orders wait for the bar to close, unless the declaration says otherwise.
Four mistakes this model causes
| Mistake | What happens | Fix |
|---|---|---|
Expecting a total to accumulate without var | total = total + x is OS2001; total = total[1] + x is absent for ever | var total = 0, then total += x |
| Computing an indicator where it is used | A stateful call inside a branch advances only on some bars (OS8001) | Compute at the top level, branch on the result |
| Wrapping a plot in a condition | OS3006 | Plot none on the bars to hide |
| Storing a bar index and trusting it later | Indices shift when older history loads | Store time instead |
Related. Script structure, Bars and history, Persistence, Warmup, Realtime and confirmation, Variables and scope, User functions