
Limits
Every limit the OpenScript engine enforces, its value, whether a script can change it, and what happens when a script reaches one.
On this page
This page lists every limit an OpenScript script (OpenScript is also called OpenAlgo Script) runs inside: how many loop turns a bar may take, how large an array or a string may grow, how many drawings a script may hold, and the rest. For each one it gives the value, says whether your script can change it, and explains what to do when you reach it. You need it when a study stops with an OS5xxx error, and before you write a script that loops heavily or keeps a lot of state.
Every limit at a glance
The values below are the ones the engine in openalgo-script 0.5.0 applies when the host sets nothing else, which is how scripts run on the /trading page. Two of them, the loop budget and the array ceiling, are fixed by the language itself. The others are the engine's defaults, and a host is allowed to set its own.
| Limit | Value | Can the script change it | Checked | Reported as |
|---|---|---|---|---|
| Loop turns per bar, all loops together | 2,000,000 | Yes, with limits(loops = n) | While the bar runs | OS5001 |
| Retained history depth | Every bar on the chart | Yes, with limits(history = n) | While the bar runs | OS4002 |
| Elements in one array | 1,000,000 | No | While the bar runs | OS5002 |
| Characters in one string | 100,000 | No | While the bar runs | OS5008 |
| Drawing objects held at once | 10,000 | No | When an object is created | OS5010 |
| Nesting of expressions, and of blocks, in the source | 128 levels | No | When the file compiles | OS5005 |
| Depth of nested function calls | 64 | No | When the program loads | OS5005 |
Data requests (req.timeframe() and req.symbol() reads) | No ceiling unless the host sets one | No | When the program loads | OS5006 |
| Instructions in the compiled program | No ceiling unless the host sets one | No | When the program compiles or loads | OS5009 |
| State regions (the stored state of stateful calls) | No ceiling unless the host sets one | No | When the program compiles or loads | OS5004 |
| Time per bar | No clock unless the host sets one | No | While the bar runs | OS5007 |
Largest value limits() may ask for | No ceiling unless the host sets one | No | When the program loads | OS5003 |
Lines written by print() | The host's rate limit. The /trading page does not show the log in this release | No | As lines are written | The host says how many lines it dropped |
| Bars the script runs over | The host's. The /trading Backtest panel runs up to 100,000 | No | Before the run | The Backtest panel asks for a shorter range |
Each row has its own section below. The OS5xxx error page carries the exact message, the placeholders it is filled with and a before and after example for every code.
Two rules behind every limit
A limit in OpenScript is a number you can see, with a reason you can read and, where it makes sense, a line you can write to change it. Two rules follow, and they hold for every row above.
- A limit that is exceeded is reported, never absorbed. A loop that runs out of budget stops the bar and says so. It does not break out of the loop and carry on, because a loop that ran two million times and then quietly stopped produces a plausible wrong number, and a plausible wrong number is worse than no number.
- A host that will not spend what a script asks for says so. It refuses when the program loads, with OS5003, naming the option, the value asked for and the most it allows. It never caps the value silently, because a script that ran under a smaller budget than it asked for would produce numbers its author never asked for and could not reproduce.
When a bar stops on a limit, the study stops there. On the /trading page, the Objects panel marks the study with Error, and if it stops as you add it to the chart, a notification shows the code, the message and the fix.
The limits() line
Two limits belong to the script, and both are set in one place: a limits() line straight after the declaration.
version 1

study("Close clustering", precision = 0)
limits(loops = 4_000_000)  // 2,500 closes compared pairwise is about 3.1 million turns

windowLen = input(2500, "Closes compared", min = 2, max = 2500)
bandTicks = input(4, "Band, in ticks", min = 1, max = 100)

var closes: array<number> = []
push(closes, close)
if size(closes) > windowLen
    shift(closes)

band = bandTicks * orElse(chart.tickSize, 0.05)
closeCount = size(closes)

// The pairwise scan runs on the newest bar only: its answer describes the
// present, and running it on every bar would repeat the same work thousands
// of times.
pairs = 0
if bar.isLast
    for i = 0 to closeCount - 1
        for j = i + 1 to closeCount - 1
            if abs(element(closes, i) - element(closes, j)) <= band
                pairs += 1

plot(bar.isLast ? pairs : none, "Close pairs inside the band")
Without the limits() line, that scan stops on the newest bar with OS5001 on any chart holding more than about 2,000 bars, because 2,500 closes compared pairwise take about 3.1 million loop turns. With it, the bar completes. The comment says why the budget is raised, which is the part a reader needs.
The rules are short, and the compiler enforces them:
| Rule | Code when broken | Why |
|---|---|---|
limits() is optional | None | Most scripts never need it: none of the example scripts does |
| It appears at most once | OS3014 | Two would need a rule for which one wins |
It is the statement straight after study() or strategy() | OS3014 | A reader sees a raised budget without searching, and the engine knows it before bar 0 |
| Its values are literal whole numbers | OS3015 | A budget computed from data, or set from an input(), cannot be known before the run starts |
Its options are loops and history | OS3002 | Nothing else is the script's to set |
version 1

study("Heavy")

len = input(20, "Length")
limits(loops = 5_000_000)
plot(sma(close, len), "Average")limits(loops = 5_000 * 1_000)Underscores in a number are allowed and make large budgets readable: 4_000_000 is four million.
The loop budget
Every turn of every loop, added up over all the loops that run during one bar, counts against one per-bar budget. The default is 2,000,000.
Going over it is OS5001. The message names the budget in force and the line of the loop that was running when it ran out, and its fix suggests a budget twice the current one, rounded up (4,000,000 for the default). The bar stops, and the study stops with it.
Three details are deliberate:
- Per bar, not per loop. A script with one nested loop is treated the same as a script with ten loops one after another. A per-loop budget would let a script with twenty loops do twenty times the work of a script with one.
- Reset every bar. A long chart is never, by itself, a reason to fail.
- Stop rather than break out. See the two rules above.
The budget exists because a script runs inside a chart in your browser, and a loop whose exit condition is never met would freeze the page. The most common way to reach it is not a big loop but a while with no bound:
i = 0
total = 0.0

// Before: nothing in the body changes i, so while the condition is true this
// never ends, and the bar stops with OS5001.
while close[i] > close[i + 1]
    total += close[i]

plot(total, "Total")
i = 0
total = 0.0
// After: a bound and an increment. The cap is a decision you can defend, and
// the loop cannot spin.
while i < 500 and close[i] > close[i + 1]
total += close[i]
i += 1
plot(total, "Sum of the latest rising run")When you reach it, ask which of two things is true. Either the loop has a bug, and you fix the exit condition, or the script genuinely needs more, and you raise the budget in one line with a comment saying why. Before raising it, read Profiling and speed: a script that needs millions of turns on every bar is usually rebuilding from scratch something it could carry forward, and the rewrite is both faster and shorter than a raised budget.
The retained history depth
x[n] reads the value of x as it stood n bars ago. By default the engine keeps the whole history of every series it needs, so any depth works and OS4002 never appears. See Bars and history.
limits(history = n) tells the engine to keep only the last n bars of history, which bounds memory on a very long chart. Reads up to x[n] then work, and a read deeper than that is OS4002. That is different from reading before the chart begins, and the difference is the point of the error:
x[n]wherenis greater thanbar.indexis absent. The value never existed, so absence is the truthful answer.x[n]deeper than the retained depth is an error. The value existed and the engine threw it away. Treating that as absent would hide a real bug behind a plausible gap.
version 1

study("A week ago")
limits(history = 375)  // the deepest read below is [375]

// 75 five minute bars per NSE session, 09:15 to 15:30, so 375 bars is a week.
weekAgo = close[375]
plot(close - weekAgo, "Change over 375 bars", aqua)
The error's fix suggests a depth equal to the index that failed. If the script reads deeper somewhere else, that read fails next, so set history to the deepest index the whole script reads rather than to the number in the first message.
An index that is not a whole number, or is negative, is a different error, OS4001, raised on the bar that reads it: there is no half a bar ago, and reading the future is not available at any price.
The array ceiling
An array holds at most 1,000,000 elements. Going over it is OS5002, naming the array and the size it reached. limits() does not raise it in version 1, because an array that large is almost always a window that is never trimmed rather than a real need.
Decide how much of the past you need and drop the rest as you go:
var window: array<number> = []

push(window, close)
if size(window) > 500
    shift(window)

plot(avg(window), "Mean of the last 500 closes", aqua)
A neighbouring error has the same root: an index outside an array is OS4004, an error rather than absence, because an array has an extent your script chose. See Collections.
The string ceiling
A string holds at most 100,000 characters. Going over it is OS5008, with the length it reached in the message. The check happens before the string is built, so str.repeat() asked for a huge result stops cleanly rather than exhausting memory.
The usual way to reach it is text accumulated into a persistent string, a piece per bar, that nothing ever trims.
// Before: grows by one piece on every bar, for ever, and stops with OS5008
// once the chart holds enough bars.
var closesText = ""
closesText += text(close, 2) + ", "

panel = table("Latest closes", 1, 1, position = "bottomLeft")
if bar.isLast
    cell(panel, 0, 0, closesText)
// After: keep the pieces, trim to what you show, join only those.
var closePieces: array<string> = []
push(closePieces, text(close, 2))
if size(closePieces) > 10
shift(closePieces)
panel = table("Latest closes", 1, 1, position = "bottomLeft")
if bar.isLast
cell(panel, 0, 0, str.join(closePieces, ", "))Drawing objects held at once
A script holds at most 10,000 drawing objects at once. A drawing lasts until the script deletes it. When a script tries to create one more than the ceiling, the bar stops with OS5010, naming the number it would have reached. The oldest drawing is never dropped to make room: a study that is right on the right of the chart and quietly wrong on the left is worse than one that stops.
The fix is to delete what you no longer want and bound the set:
maxZones = input(50, "Zones kept", min = 1, max = 500)

var zones: array<box> = []

breakout = crossUp(close, highest(high, 20)[1])
if breakout
    push(zones, draw.box(time, high, time + 3600000, low))

// Keep the newest maxZones boxes: delete the oldest drawing and remove its
// element together, so the array and the chart never disagree.
if size(zones) > maxZones
    draw.delete(element(zones, 0))
    shift(zones)

plot(draw.count(), "Objects held")
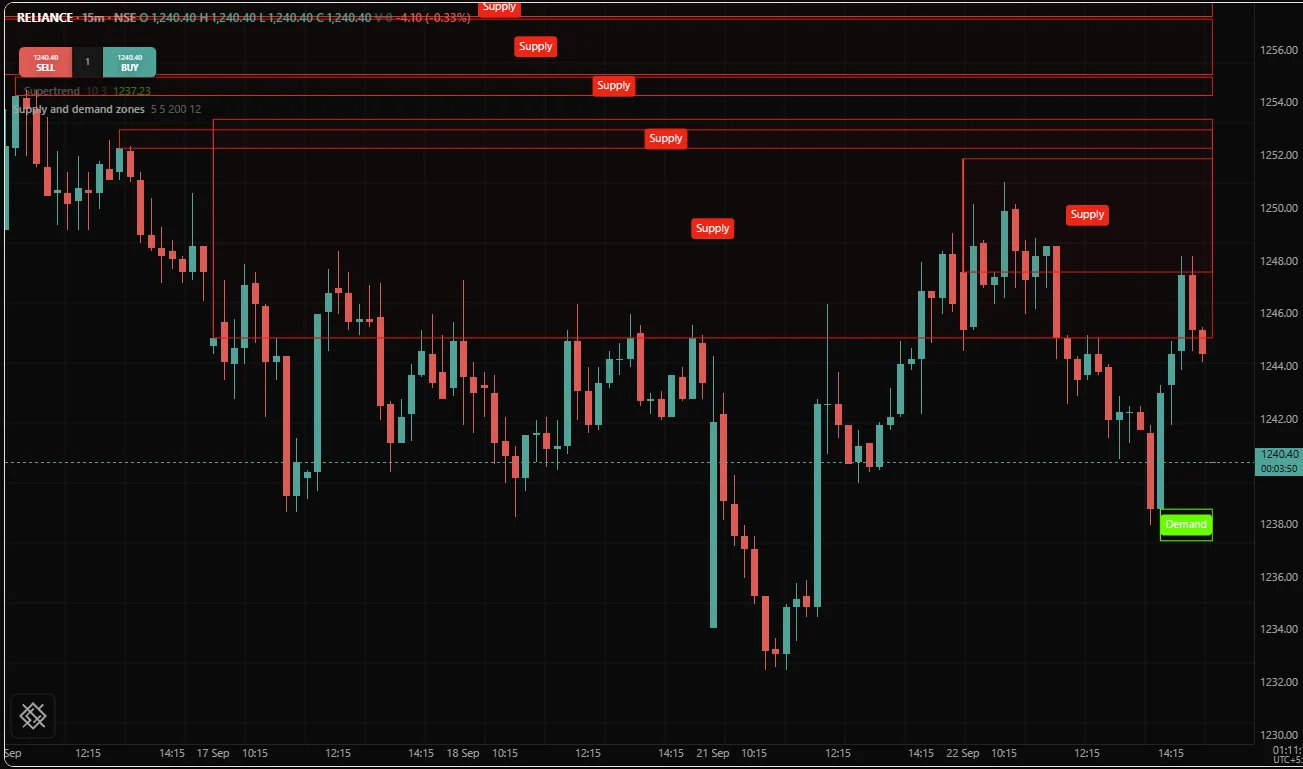
draw.count() reports how many objects the script holds. Put it in a debug panel while you develop: a count that rises for ever is a leak, and you see it in a minute rather than in an hour. See Lines and boxes.
Nesting and call depth
The source may nest expressions, and separately blocks, 128 levels deep. Going deeper is OS5005 when the file compiles. The ceiling keeps the compiler inside a bounded stack so that no file can stop the page, and it is far above anything a person writes by hand: generated source is the usual way to reach it.
Function calls may nest 64 deep at run time, a function calling a function calling a function. A program that would go deeper is refused with the same code when it loads. Recursion, a function calling itself, is not allowed at all (OS2005), so the depth of any program is known before the first bar.
If you meet either, the fix is also the readable change: give the inner part a name. The same habit helps long before any ceiling, as in this nesting of four levels.
a = close > open
b = volume > 0
c = high > high[1]
d = low < low[1]

// Before: legal, and hard to follow.
code = a ? b ? c ? d ? 1 : 2 : 3 : 4 : 5
plot(code, "Bar code")
a = close > open
b = volume > 0
c = high > high[1]
d = low < low[1]
// After: the same value, with the inner choice named.
inner = c ? (d ? 1 : 2) : 3
code = a ? (b ? inner : 4) : 5
plot(code, "Bar code")Data requests
Each req.timeframe() or req.symbol() read is a separate series kept in step with the chart's bars: a req.timeframe() read of the chart's own instrument is built from the chart's bars, and a req.symbol() read is fetched by the host. A host may set a ceiling on how many reads one file makes; the /trading page sets none. A file with more is refused with OS5006 when it loads, naming the count and the ceiling. It is refused rather than having the extra requests dropped, because a dropped request is a plot that quietly turns absent. A read written inside another read counts as one more request.
The fix is nearly always to stop asking twice for the same thing. Two reads with the same arguments are still two requests, so read once, name the result and reuse the name.
// Before: the same read written twice is two requests.
plot(req.timeframe("1D", high), "Previous day high", orange, style = "step")
brokeOut = crossUp(close, req.timeframe("1D", high))
background(brokeOut ? fade(orange, 80) : none)
// After: one request, named, and the name used twice.
prevDayHigh = req.timeframe("1D", high) // the last completed day's high
plot(prevDayHigh, "Previous day high", orange, style = "step")
brokeOut = crossUp(close, prevDayHigh)
background(brokeOut ? fade(orange, 80) : none)Delete reads whose results you do not use: an unused read still costs a whole series, and the unread name earns warning OS8010. See Higher timeframes and Other instruments.
Program size and state regions
The compiled program is held in memory for every chart and every running strategy that uses it, so a host may set how large a program it will hold. A file that compiles to more instructions than that is OS5009. You will not reach it by writing a study by hand. A file that size is nearly always repeated blocks that a function would collapse, or generated source.
A host may also cap the number of state regions, the stored state of every stateful call such as ema(), counted per call path. The count multiplies when several functions each call the next more than once, and a program over the cap is OS5004, naming the two functions where the multiplication happened.
fn inner(src) => ema(src, 20)
fn outer(src) => inner(src) - inner(src[1])

// Before: two calls of outer, each calling inner twice, so four separate
// averages are kept and updated on every bar.
v = outer(close) + outer(hlc3)
plot(v, "Four averages")
fn inner(src) => ema(src, 20)
// After: one call per source at the top level, and the previous bar's value
// read from the name's history. Two averages, and the same numbers once
// both have warmed up.
closeAvg = inner(close)
typicalAvg = inner(hlc3)
v = (closeAvg - closeAvg[1]) + (typicalAvg - typicalAvg[1])
plot(v, "Two averages")Time per bar
The loop budget counts turns, not time, so a script can be well inside it and still be slow. A host running many strategies can give each bar a wall clock budget so that one script cannot starve the rest. A bar that takes longer is OS5007, naming the bar, the time it took and the budget. There is no limits() option for it. The engine as shipped reads no clock at all unless the host asks it to, because a default time limit would let the same script pass on a fast machine and fail on a slow one.
The usual cause is work recomputed over the whole history on every bar:
// Before: on bar 40,000 this loop runs 40,001 times.
total = 0.0
for i = 0 to bar.index
    total += close[i]

plot(total / bar.count, "Mean since the first bar")
// After: one addition per bar. The mean is the same apart from rounding in
// the last digits, because the closes are added in a different order.
var total = 0.0
total += close
plot(total / bar.count, "Mean since the first bar")cum() is this running total ready made. Profiling and speed covers the pattern in full.
How many bars you get
The number of bars a script sees is the host's decision, not the language's. On the /trading page a study runs over the bars the chart has loaded, and the Backtest panel runs over the date range you pick, up to 100,000 bars. There is no setting in the script for how far back it may look and no bar at which a script starts for real: a script runs on bar 0 exactly as it runs on bar 40,000, and warmup is expressed entirely through the absent value. See Warmup.
Two things follow in practice.
bar.indexis a position in the bars the engine was given, not an address. Loading more history shifts every index, so a stored index points at something that moved. Storetimeinstead: a bar's time does not move.- How much history you get is a question about the data, not the script. If a study needs 200 bars of warmup and the chart holds 300, most of the chart is warmup. Say in the script's header how much history it needs. See Sharing scripts.
When you reach a limit
| You see | First ask | Then do |
|---|---|---|
| OS5001 | Does this loop end on every bar? | Fix the exit condition; if it is right, raise loops and comment why |
| OS5007 | Does any loop's length depend on bar.index? | Carry the value forward in a var, or use cum() |
| OS4002 | Is the deep read intended? | Set limits(history = n) to the depth the message suggests |
| OS5002 | Is this array a window or a log? | Trim on push; a window needs a fixed length |
| OS5010 | Does every object I draw ever get deleted? | Delete the oldest as you create the newest, and remove its array element with it |
| OS5008 | Am I building text on every bar for output shown once? | Keep the pieces in an array, trim it, and join on bar.isLast |
| OS5009 | Are there repeated blocks? | Extract a function |
| OS5004 | Does a function call another more than once on several paths? | Call the inner one once at the top level and pass the name down |
| OS5005 | Is this expression readable? | Name the inner part |
| OS5006 | Is any request a duplicate? | Read once, reuse the name, delete unused reads |
| OS5003 | Do I really need this budget? | Lower it, or run the file where the host allows more |
Related. Profiling and speed, Debugging, Testing scripts, Style guide, OS5xxx Limits errors, Bars and history