
Visuals overview
Everything an OpenScript study can put on a chart, which call draws each picture, which pane it lands in, and what each one adds to the study.
On this page
A script produces two kinds of output: numbers, and pictures made from numbers. This page is the map of the pictures. It names every call in OpenScript (also called OpenAlgo Script) that draws on a chart, says what each one is good at, and gives you four questions that pick the right one. Read it before the detailed pages, so that when you want a line, a band, a marker or a shaded zone you already know which call to reach for.
The four questions are always the same:
- Is the thing one value per bar, or a shape that spans several bars?
- Does it have a price to sit at, or is it a fact about the whole bar?
- Is it fixed before the first bar runs, or does it appear and disappear as bars arrive?
- Which pane should a reader find it in?
Answer those four and the call chooses itself.
One study, one of each surface
Here is a complete overlay study (one drawn over the price candles) that uses most of the drawing calls at once, so you can see them side by side. Save it in the Scripts panel of the /trading page and apply it to any NSE chart.
version 1
study("Surface tour", overlay = true)

len = input(20, "Length", min = 2, max = 500)

basis = sma(close, len)
band  = 2 * stdev(close, len)

// Two named plots, so the fill has two columns to shade between.
pUpper = plot(basis + band, "Upper", aqua)
pLower = plot(basis - band, "Lower", aqua)
plot(basis, "Basis", orange, width = 2)

fill(pUpper, pLower, color = aqua, opacity = 0.08)

// A regime has no price to sit at, so it is painted rather than plotted.
// Absent during warmup, so the candles keep their own colours there.
trendColor = isNone(basis) ? none : (close > basis ? lime : red)
barColor(trendColor)
background(close > basis + band ? fade(orange, 93) : none)

// An event, on the one bar it happened.
if crossUp(close, basis + band)
    signal("BREAKOUT", at = "above", shape = "triangleUp")
Read it as: three plotted lines, one shaded band between two of them, a colour on every candle, a faint wash on the bars where price closed above the upper band, and a marker on the bars where it first crossed out.
The surfaces
Everything a script draws lands on one of seven surfaces.
| Surface | Calls | What it draws |
|---|---|---|
| Plotted columns | plot(), plotCandles() | One value per bar, drawn as a line, a step, an area, a histogram, columns or candles |
| Shaded bands | fill() | The region between two plotted columns |
| Horizontal levels | level() | One line straight across the pane at one price |
| Bar markers | signal() | A named marker on one bar |
| Per-bar paint | barColor(), background() | A colour for the bar's candle, or a shade behind the bar's whole column |
| Drawing objects | draw.line(), draw.label(), draw.box(), draw.polyline() | Objects anchored to a time and a price, created, moved and deleted over many bars |
| The pinned grid | table(), cell() | A panel fixed to a corner of the pane, showing the current state rather than a history |
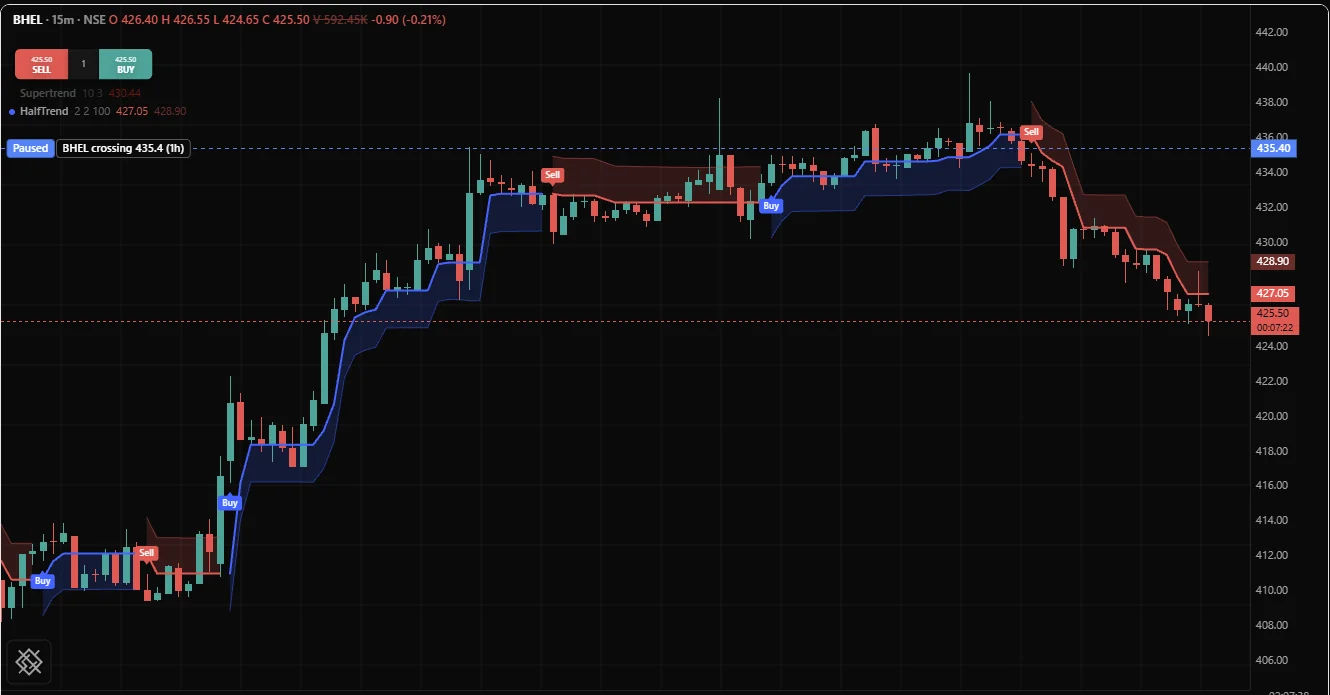
Plots, fills and markers together look like this on a real chart. This HalfTrend study on a BHEL 15 minute chart draws its trend level as two plots, blue while the trend is up and red while it is down, shades a channel beside the level with two fills, and puts a labelled marker on each flip:
Two more calls produce output that is not drawn at all. People look for them here, so they belong on the map: alert() raises an alert on the bar it runs on, and print() writes a value to the script's log. See Alerts from scripts and Debugging.
If you want this, use that
Keep this table open while you write. The last column names the page that covers the call in full.
| If you want | Use | Explained in |
|---|---|---|
| A moving average drawn over price | plot(value, "Title", colour) | Plots |
| A value that changes once a session or once a day | plot(..., style = "step") | Plots |
| An oscillator histogram coloured by sign | plot(h, "Hist", color = h > 0 ? lime : red, style = "histogram") | Plots |
| Volume as columns in a pane of its own | plot(volume, "Volume", style = "column") | Plots |
| Candles built from your own four values | plotCandles(o, h, l, c, "Title") | Plots |
| A plot pushed forward or back along the time axis | plot(..., offset = n) | Plots |
| One line of a pane study drawn over price | plot(..., overlay = true) | Plots |
| A second series on the left price axis | plot(..., scale = "left") | Plots |
| A shaded band between two lines | fill(plotA, plotB, ...) | Fills |
| A band that changes colour with which line leads | fill(a, b, colorUp = ..., colorDown = ...) | Fills |
| Shading between a line and a fixed value | An invisible second plot, then fill | Fills |
| A fixed reference line at 70, 30 or zero | level(70, "Overbought", ...) | Levels |
| A line at the previous day's high | level(dayHigh, "Previous day high", ...) | Levels |
| A pane whose scale never rescales | study(..., range = [0, 100]) | Levels |
| How many decimals a study's own pane shows | study(..., precision = 2) | Levels |
| A pane axis that reads as a percentage or a volume | study(..., format = "percent") | Levels |
| A colour that fades, blends or changes per bar | fade, mix, a ternary | Colors |
| A mark on the one bar something happened | signal("BUY") | Labels and shapes |
| A plate of text at a price | draw.label(t, p, "Text") | Labels and shapes |
| The candles recoloured by regime | barColor(colour) | Bar colouring and backgrounds |
| The whole bar column shaded behind everything | background(colour) | Bar colouring and backgrounds |
| A trendline between two points in the past | draw.line(t1, p1, t2, p2) | Lines and boxes |
| A zone that is extended and later deleted | draw.box(...), then the draw setters | Lines and boxes |
| A readings panel in a corner | table(...) and cell(...) | Tables |
| An alert when a condition is met | alert(...) | Alerts from scripts |
| A value written to the log while debugging | print(value) | Debugging |
Three rows of that table are worth their reasons, because they are where people most often reach for the wrong call.
A crossing is not a plot. A crossing happens on one bar. A plotted column carries one value on every bar, so the only way it can show an event is by being absent everywhere else, which spends a whole column on one dot. signal() is the call for an event: one call, one named marker, with at and shape when you care where it sits and what it looks like.
A regime is not a price. "The trend is up", "the opening range is still forming", "volatility is unusually high": none of these has a price to sit at. Drawing one as a line puts a flat series through the price scale saying something that has nothing to do with price. background() shades the bar's whole column and barColor() recolours the candle itself. Both take none to mean "leave this bar alone", which is how a conditional paint switches itself off.
A fixed reference is not a plot either. A line at 70 does not need a column of identical numbers, a value in the legend and a group of rows in the settings dialog. level() draws it with one call and none of those.
Where each call may appear
Some drawing calls declare the fixed shape of the study, and the rest are per-bar events. This rule catches everyone once.
| Calls | Where they may appear | Why |
|---|---|---|
plot, plotCandles, fill, level, table | Top level only. Inside an if, a loop or a function it is OS3006 | They declare the study's fixed shape. The legend, the settings dialog and the pane are built before the first bar runs, so the set of columns, bands, levels and grids must be known when the script compiles |
input | Top level only. Inside a block or a function it is OS3007 | Each input is one row of the settings dialog, built before the first bar |
signal, barColor, background, cell, print, alert, everything in draw | Anywhere | They are per-bar events and per-bar paint. Nothing about them has to be known in advance |
So you never hide a plot by wrapping it in an if:
trending = adx(14, 14)[0] > 25
ema20 = ema(close, 20)

if trending
    plot(ema20, "EMA 20", aqua)
You hide it by giving it the absent value, none, on the bars where you do not want it:
trending = adx(14, 14)[0] > 25
ema20 = ema(close, 20)

plot(trending ? ema20 : none, "EMA 20", aqua)
The same idea works on every surface. Absence reaching a drawing surface is a gap, never a zero, and that one rule is what makes "hide it with none" work everywhere without a second mechanism. Absent values explains where none comes from.
| Surface | What an absent value does |
|---|---|
| A plotted column | The line breaks. Nothing is drawn on that bar |
| A shaded band | The band stops, and resumes where both ends have values again |
| A level | A level is drawn at its price on the last bar, so an absent price there means no line at all |
| A marker | No marker on that bar |
barColor | The candle keeps its own colour |
background | The bar's column is not shaded |
| A table cell | The cell is left blank |
What costs a plot slot
A plot slot is one plotted column. It keeps a value for every bar, shows its current value in the study's legend (the row at the top of the pane with the study's name), and gets its own group in the Style tab of the settings dialog, where the user can change its colour, opacity, thickness, line style and plot style without editing your script. Only two calls create one.
| Call | Plot slots | Kept per bar |
|---|---|---|
plot(...) | One | Its value, plus a colour when the colour is worked out bar by bar |
plotCandles(...) | One | Four values: open, high, low and close |
fill(...) | None: it names two plots that already exist | Nothing of its own |
level(...) | None | Its price, of which the last bar's is drawn |
signal(...) | None | Its text, on the bars it fires |
barColor(...), background(...) | None | One colour per bar each |
table(...), cell(...) | None | The cells as last written |
draw.* | None | The objects the script is holding |
alert(...) | None | Its condition and its message |
Two consequences come up in real scripts.
A function with several outputs costs one slot per output you draw. macd() returns three numbers in one array, from one call and one piece of state. Drawing all three is three plot calls and three slots. Drawing only the histogram is one slot, and the other two outputs cost nothing.
A shaded band needs its two edge plots even when you do not want the lines. When the band is the whole point, keep the plots and make them invisible with a fully transparent colour. fade() takes transparency, and 100 is invisible:
basis = sma(close, 20)
band  = 2 * stdev(close, 20)

pUpper = plot(basis + band, "Upper", fade(aqua, 100))
pLower = plot(basis - band, "Lower", fade(aqua, 100))
fill(pUpper, pLower, color = aqua, opacity = 0.08)
An invisible plot draws nothing, and the legend leaves out its value. Name the band's colour yourself, as here: a band given no colour takes its first plot's colour, and that colour is invisible.
Only plots appear in the Style tab. When you pass a colour input straight to a plot, by the input's own name, the plot's colour in the Style tab and the input are one setting. See Inputs and Settings and style.
Which pane a thing lands in
A study is either drawn over the instrument's candles or given a pane of its own, and the declaration decides which. overlay defaults to false, so a study with no overlay argument gets its own pane below the price.
version 1
study("Relative strength", precision = 2, range = [0, 100])

plot(rsi(close, 14), "RSI", purple, width = 2)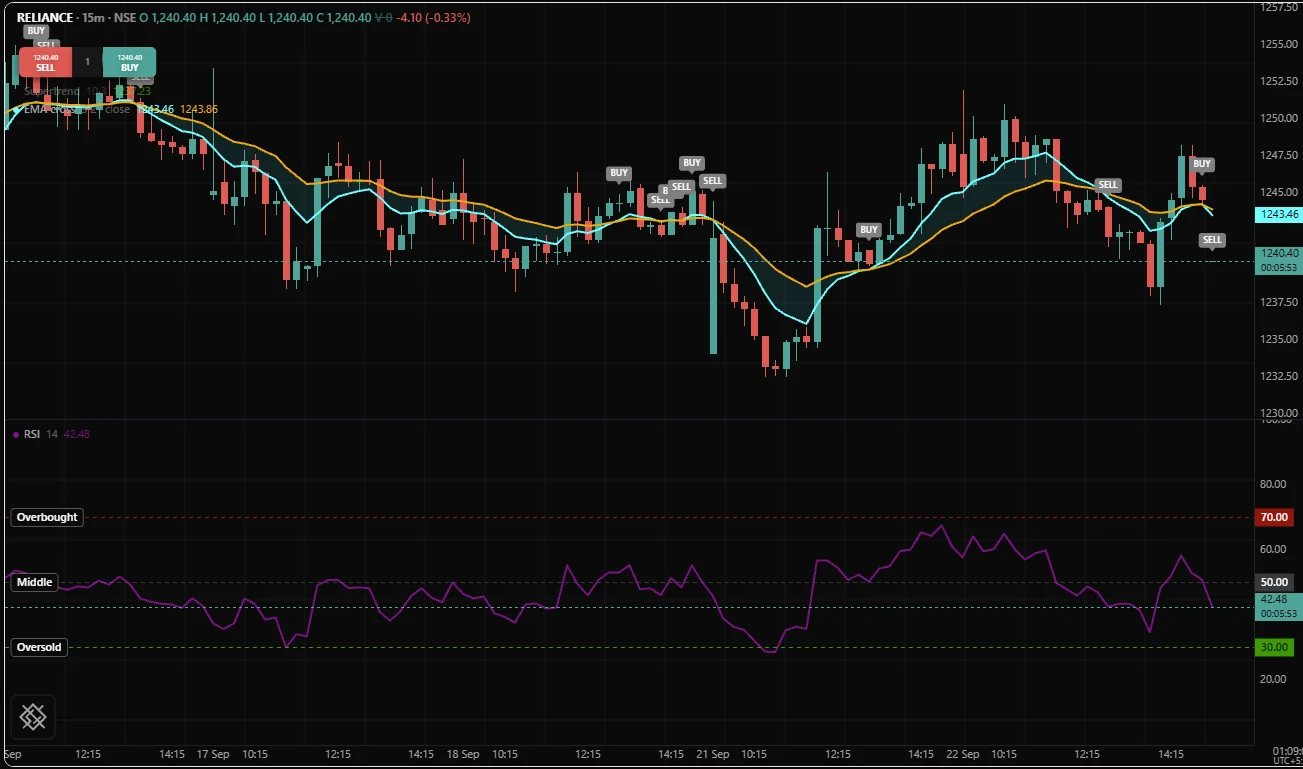
The declaration sets the default for everything the file draws. Two calls can override it item by item, and the rest cannot.
| Thing | Where it draws | Can one item be moved? |
|---|---|---|
plot(...) | The study's pane | Yes: overlay = true puts this one column on the price pane |
plotCandles(...) | The study's pane | No: it has no overlay argument |
fill(...) | The study's pane | Yes, with its own overlay argument. Move its two plots with it |
level(...) | The study's pane | No: a level has no overlay argument |
signal(...) | Over price, above or below the candle. In a study with its own pane, above or below the study's first plot | No |
background(...) | The study's pane, the full height of the bar's column | No |
barColor(...) | The instrument's own candles on the price pane, even from a study with its own pane | No |
table(...) | A corner of the study's pane | No, but position picks the corner |
draw.* | The study's pane, at a time and a price on that pane's scale | No |
barColor is the one that surprises people, and it is deliberate: a trend reading computed in a pane below the chart is most useful painted onto the candles the trader is watching, and forcing the study to be an overlay just to reach them would mean giving up its own axis. The candles are one object, so when two studies both colour them, only one study's colouring is shown, decided by the order of the studies on the chart.
A study with its own pane and no plot at all draws no markers, because its markers have no line to sit on.
Within a pane, a plot's scale argument picks the price axis it maps to:
scale | Means |
|---|---|
"right" | The right-hand axis. The default |
"left" | The left-hand axis, for a second series in different units. It appears when a plot uses it |
"none" | A hidden scale of its own, fitted to this column alone, so it never stretches the axis the other plots read against |
Declaration options that shape the picture
Five options on study(...) decide how the whole study is drawn. Each must be fixed when the script compiles. They are covered in full in Declarations.
| Option | Default | Controls |
|---|---|---|
overlay | false | true draws on the price pane, false gives the study its own pane |
precision | 4 | Decimals on the axis and legend of a study with its own pane, a whole number from 0 to 10. Over the price pane the instrument's own formatting is kept |
format | "price" | "price", "percent" or "volume": how the study's own pane axis and legend read |
range | none | [min, max] fixes the study pane's scale, as in [0, 100] |
scale | "right" | Accepted, but the /trading chart does not apply it in this release. Set scale on each plot instead |
The order things are painted in
The /trading chart paints each pane in four layers, bottom to top:
| Layer | Holds |
|---|---|
| 1, behind the data | Shading from background(...) and bands from fill(...) |
| 2 | The instrument's candles (on the price pane), then plotted columns and candle plots in the order they were added |
| 3 | Levels, markers from signal(...) and drawing objects from draw |
| 4, on top | The grid from table(...) and cell(...), which covers whatever is under its corner |
Four facts are enough to design with:
- Bands and backgrounds sit behind the candles and lines, so they never hide them. A strong one still drowns their colours, so keep both faint.
fade(silver, 92)reads as a tint;silverat full strength reads as a bug. - A
fillgiven no colour takes its first plot's colour at twelve percent strength. Name a colour and you get that colour, dimmed only byopacity, which starts at 1. - Within one study, plots are painted in the order you declare them, so a plot declared first sits under the ones declared after it. That is the cheapest control you have over what covers what.
- An absent value removes a layer for that bar rather than painting a zero over what is underneath.
Two more worked examples
An oscillator with its own pane, scale and lines
version 1
study("RSI with a zone", precision = 2, range = [0, 100])

len = input(14, "Length", min = 2, max = 200)

r = rsi(close, len)

// Levels, not plots: horizontal lines with no columns and no legend values.
level(70, "Overbought", fade(red, 40))
level(30, "Oversold", fade(lime, 40))

pOsc = plot(r, "RSI", purple, width = 2)

// The midline exists only so the fill has a second column to name.
// Fully transparent, so it draws no line of its own.
pMid = plot(50, "Midline", fade(gray, 100))

fill(pOsc, pMid, colorUp = fade(lime, 86), colorDown = fade(red, 86))
range = [0, 100] fixes the pane's scale, so 70 sits at the same height on every chart you open. That is the reason to fix a range: a reading with real bounds should keep them on screen.
A pane study that reaches onto the price chart
version 1
study("Trend strength", precision = 2, range = [0, 100])

diLen  = input(14, "DI length",  min = 1, max = 100)
adxLen = input(14, "ADX length", min = 1, max = 100)

strength = adx(diLen, adxLen)[0]

// Computed at the top level, on every bar. A stateful call placed inside a
// branch would only advance on the bars that branch ran.
e20 = ema(close, 20)

level(25, "Trending above here", fade(gray, 50))
plot(strength, "ADX", purple, width = 2)

// This one column belongs where the trader is looking, not down here.
plot(strength > 25 ? e20 : none, "EMA 20 while trending", orange, width = 2, overlay = true)

// And the candles themselves carry the regime: greyed out while the market
// is not trending, left alone while it is and during warmup.
barColor(isNone(strength) or strength > 25 ? none : fade(gray, 60))
Three things are worth noticing. The study owns a pane, yet one of its columns is on the price pane and so is its bar colouring. The average is computed on every bar and only the drawing is conditional: computing it inside the ternary or an if would raise warning OS8001 and leave holes in the line. And barColor(none) on the trending bars leaves those candles their own colour, which is a stronger picture than painting them a second colour. The isNone test keeps the warmup bars, where adx() has no value yet, from being greyed out as if they were quiet.
Choosing between a plot, a level and a drawing
These three overlap, and picking the wrong one gives a script that works and then becomes painful to change.
plot | level | draw.line | |
|---|---|---|---|
| Shape | One value per bar | One horizontal line across the pane | A segment between two anchored points |
| How many | Fixed when the script compiles, one per call | Fixed when the script compiles, one per call | As many as the script creates, at any time |
| Value | A different value on every bar | One price, read again every bar; the last bar's wins | Two points, movable later |
| History | Every bar's value is drawn, and the series can be read back with [] | None: you see one line | Each object stays until deleted |
| Cost | A plot slot | No plot slot | No plot slot, but memory per object |
| Good for | An indicator, a band edge, a stop that moves every bar | A threshold, the previous day's high, a zero line | A trendline between two pivots, a zone, an annotation |
The tie-breaker: if the thing has a value on every bar, plot it. If it has one value that the whole pane should show at a single height, make it a level. If it starts somewhere in the past and ends somewhere else, draw it.
Related: Plots, Levels, Fills, Colors, Bar colouring and backgrounds, Labels and shapes, Lines and boxes, Tables, Plotting reference.