
Labels and shapes
Mark an event on a bar with signal, place text you own with draw.label, anchor it at a price that works on any instrument, and put the detail in a tooltip.
On this page
Two calls put text and marks on a chart. signal() marks an event on the bar
it happened on, such as a crossover or a breakout. draw.label() places a
plate of text at a time and a price you choose, and keeps it there until your
script moves or deletes it.
This page shows how to choose between them, how to position each one so it reads the same on an NSE stock at 23.40 and an index future in the tens of thousands, how to put detail in a tooltip, and when a label is the wrong tool altogether.
Two tools, and the difference matters
signal(text, ...) | draw.label(t, p, text, ...) | |
|---|---|---|
| Is | A marker on this bar | An object you own |
| Anchored to | The bar it fired on: above it, below it or on it | A time and a price you compute |
| Lifecycle | None. It fires on a bar or it does not | Created, moved, retexted and deleted by your script |
| How many | At most one per call site per bar | As many as you create |
| On the forming bar | Waits until the bar closes | Drawn at once, rolled back when the bar runs again |
| What it costs | Nothing to manage | One object, held until you delete it |
The short version: an event on a bar is a signal; a thing placed on the
chart is a draw.label. A crossing, a breakout and a gap are events. The
reading pinned beside the newest bar and the caption on a zone are things.
Choosing wrongly is not a matter of style. A signal has no lifecycle to get
wrong, no handle to go stale and no object count to keep down, so every event
marked with a label instead is work you have taken on for nothing.
Markers with signal
Here is a complete study that marks both directions of a crossover between two exponential moving averages (EMAs), a fast one and a slow one:
version 1
study("Crossing markers", overlay = true, precision = 2)

fastLen = input(9, "Fast length", min = 1, max = 500)
slowLen = input(21, "Slow length", min = 1, max = 500)

// Both averages are computed on every bar, outside any if.
fast = ema(close, fastLen)
slow = ema(close, slowLen)

plot(fast, "Fast", aqua, width = 2)
plot(slow, "Slow", orange, width = 2)

// State the side on every call.
if crossUp(fast, slow)
    signal("BUY", color = lime, at = "below", shape = "triangleUp")

if crossDown(fast, slow)
    signal("SELL", color = red, at = "above", shape = "triangleDown")
The averages are computed at the top level and only the markers sit inside the
if. A stateful call such as ema() advances only on the bars where it runs,
so one computed inside the branch would see only the crossing bars and draw a
broken line. The compiler warns about that with
OS8001.
signal is the whole of shape plotting in OpenScript. One call carries the
text, the colour, the position and the shape:
| Argument | Takes | What it does |
|---|---|---|
text | string | The text the marker carries. No text on a bar means no marker on that bar |
color | color | The marker's colour. Leave it out for the chart's default marker colour |
at | "above", "below" or "price" | Above the bar (the default), below it, or on the bar itself |
shape | one of the ten shapes below | The mark itself. "label", a plate carrying the text, is the default |
| Shapes | Names |
|---|---|
| Plate | "label" |
| Direction | "arrowUp", "arrowDown", "triangleUp", "triangleDown" |
| Point | "circle", "square", "diamond", "cross" |
| Flag | "flag" |
Always say where the marker goes. at defaults to "above", so a call that
names no side sits above the bar whatever its text says. Nothing reads the word
"BUY" and moves the marker below the bar for you.
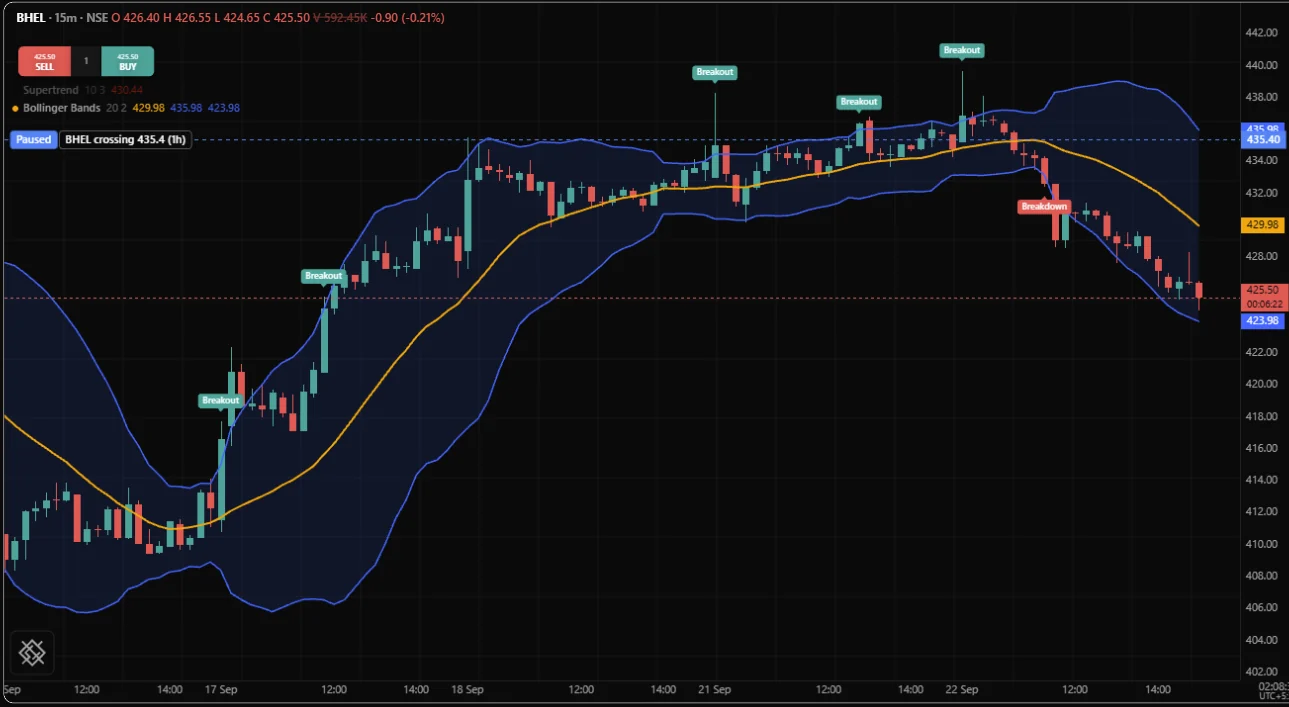
Here is the default "label" shape on a BHEL 15 minute chart. The
Bollinger Bands study
from Example scripts puts a teal Breakout plate on each bar whose close crossed
above the upper band and a red Breakdown plate on each bar whose close crossed
below the lower band, with a colour and a side stated in each call:
Position, shape and colour are fixed before the first bar
at, shape and color are part of the marker's declaration, which is settled
before the first bar runs. Each must be a literal or an input(). Only the
text is read on every bar, so a side chosen from bar data is refused with
OS3003:
side = close > open ? "above" : "below"
signal("MOVE", at = side)
When you want two sides or two colours, write two calls, as the crossing example does. When you want the reader to choose, make it an input:
where = input("below", "Marker position", options = ["above", "below", "price"])
tone  = input(lime, "Marker colour")

if crossUp(close, ema(close, 20))
    signal("UP", color = tone, at = where, shape = "circle")
One call site, one marker per bar
Each signal() call written in your source (its call site) is one marker
series with its own identity. The call site is the line in the source, not each
time that line runs. Two consequences follow:
- A call site that fires twice on one bar keeps the last text. That happens
inside a loop, and when a function that calls
signalis called more than once on a bar. A loop that signals once per element marks the bar once, with the text of the last element. If you need one mark per element, you need a drawing object per element, with the lifecycle that implies. - Markers are rebuilt from the script on every run. A signal that stops
firing because you changed an input leaves nothing behind. You never clear
markers, and there is no marker equivalent of
draw.delete().
Conditional markers
Unlike plot(), which must sit at the top level, signal may appear anywhere:
inside an if, a loop or a function. These lines mark a close above the highest
high of the previous 20 bars:
breakout = close > highest(high, 20)[1]

if breakout
    signal("BREAK", at = "above", shape = "flag")
The same marker can be written without the if:
breakout = close > highest(high, 20)[1]

signal(breakout ? "BREAK" : none, at = "above", shape = "flag")
The first is what most scripts write. The second works because an absent text is the absence of an event, not an error: no text on the bar, no marker. Use one form or the other, not both: two call sites are two markers on the same bar.
Markers wait for the bar to close
A signal does not fire on a bar that is still forming. The call is deferred until the bar closes, and if the condition that produced it is no longer true by then, the marker never appears. That is what you want from a mark you might act on: a marker that appears halfway through a bar and vanishes before the close is only showing you a condition that did not survive the bar.
A study that really does want intrabar markers says so with
onUnconfirmed = true in its declaration, and then guards any marker that should
stay settled with bar.isConfirmed:
version 1
study("Intrabar markers", overlay = true, onUnconfirmed = true)

surge = volume > 3 * sma(volume, 20)

// Fires as soon as the forming bar qualifies.
if surge
    signal("VOL", at = "below", shape = "circle")

// Waits for the close, as a signal would by default.
if surge and close > open and bar.isConfirmed
    signal("VOL UP", at = "above", shape = "arrowUp")
Realtime and confirmation covers the forming bar, and Alerts from scripts covers turning events into alerts.
Numbers in marker text
Text is a string, and OpenScript never converts a number to text on its own, so
joining the two is OS2003:
r = rsi(close, 14)
signal("RSI " + r)
Convert with text(). How it treats an absent value decides what your marker
shows during warmup:
| You write | On a warmup bar, where the value is absent |
|---|---|
"RSI " + text(r, 1) | text with decimals returns absent, the whole string is absent, and no marker appears |
"RSI " + text(r) | text without decimals returns the string "none", so the marker reads RSI none |
"RSI " + show(r, 1) with the helper below | The marker reads RSI warming up |
One helper settles it for a whole script:
fn show(value, decimals) => isNone(value) ? "warming up" : text(value, decimals)

r = rsi(close, 14)

if crossUp(r, 30)
    signal("RSI " + show(r, 1), at = "below", shape = "arrowUp")
Keep marker text short. A marker sits among the candles, and a long caption on every signal hides the price action the study is about. Put detail in a tooltip instead.
Labels with draw.label
A label is a drawing object: it has a handle, a lifecycle, setters, and a deletion you are responsible for. Everything on Lines and boxes about anchoring, moving, capping and deleting objects applies to labels unchanged.
| Argument | Takes | Default |
|---|---|---|
t | A time, in milliseconds | Required |
p | A price on the pane's scale | Required |
text | string | Required |
color | The plate colour | none: no plate, only the text is drawn |
textColor | The text colour | white |
align | "left", "center" or "right" | "center" |
tooltip | Text shown while the pointer rests on the label | "" |
The plate is centred vertically on the price p. align decides where it sits
against the time t: "center" centres the plate on it, "left" puts the
plate's left edge there so the text reads to the right of the point, and
"right" puts its right edge there. Give a label a color unless you want bare
text: with the defaults it is white text with nothing behind it, which is hard to
read wherever the chart background is light. A label whose time or price is
absent is not drawn at all, though it still counts as an object until you
delete it.
Once a label exists, these calls change it:
| Call | Changes |
|---|---|
draw.setAt() | Where it sits: a new time and price |
draw.setText() | Its text |
draw.setColor() | The plate colour |
draw.setTextColor() | The text colour |
draw.setTooltip() | The tooltip |
draw.delete() | Removes it |
The most useful label in most studies is the one pinned above the newest bar that states what the study currently reads. It is one object for the life of the chart, created once and then moved:
version 1
study("Current reading", overlay = true, precision = 2)

rsiLen = input(14, "RSI length", min = 2, max = 200)

oscillator = rsi(close, rsiLen)
band       = atr(14)

fn show(value, decimals) => isNone(value) ? "warming up" : text(value, decimals)

var tag = none

// Only the newest bar carries the label, so the work happens once per update
// rather than once per bar of history.
if bar.isLast
    caption = "RSI " + show(oscillator, 1)
    plate   = isNone(oscillator) ? gray : (oscillator > 70 ? red : (oscillator < 30 ? lime : silver))

    if isNone(tag)
        tag = draw.label(time, high + band, caption, color = plate, textColor = black)
    else
        // Moved and retexted, never recreated.
        draw.setAt(tag, time, high + band)
        draw.setText(tag, caption)
        draw.setColor(tag, plate)
Note where band is computed. atr() keeps state and advances only on the
bars where it runs, so calling it inside if bar.isLast would give it one bar of
history and an absent result. It is computed at the top level and used inside the
branch.
Placing a label
A signal takes a side, and the chart places the marker clear of the bar. A label takes a price, and the price is yours to compute. There is no "above the bar" for a label and no pixel offset anywhere in the language.
That is deliberate. A pixel offset means one thing on a chart zoomed out to five
years and another on the same chart zoomed into an hour. A fixed price offset
fails the other way: 5 points is a huge gap on a stock at 23.40 and invisible on
an index future. An offset measured in the instrument's own volatility works
everywhere, so pad labels with a multiple of atr(), the average true range
(the typical size of one bar's move on this instrument and timeframe).
This study labels each pivot with its price. A pivot high is a bar whose
high is above the highs of the leftBars bars before it and the rightBars
bars after it; a pivot low is the same for lows:
version 1
study("Pivot labels", overlay = true, precision = 2)

leftBars  = input(5, "Pivot left bars", min = 1, max = 50)
rightBars = input(5, "Pivot right bars", min = 1, max = 50)
padding   = input(0.5, "Padding, in ATR", min = 0, max = 5)
keep      = input(30, "Labels to keep", min = 1, max = 500)

pivotUp   = pivotHigh(high, leftBars, rightBars)
pivotDown = pivotLow(low, leftBars, rightBars)

// One ATR read at the top level, used by both branches below.
pad = atr(14) * padding

var tags = []

if not isNone(pivotUp) and not isNone(pad)
    push(tags, draw.label(time[rightBars], pivotUp + pad, text(pivotUp, 2),
                          color = red, textColor = white))

if not isNone(pivotDown) and not isNone(pad)
    push(tags, draw.label(time[rightBars], pivotDown - pad, text(pivotDown, 2),
                          color = lime, textColor = black))

// Labels are objects, so the list is capped. A while, because one bar can
// add two labels.
while size(tags) > keep
    draw.delete(shift(tags))
Three details in that script are the point of it:
- The anchor time is
time[rightBars]. A pivot is only knownrightBarsbars after the bar it formed on, sopivotHigh()reports it late. The label belongs on the bar where the pivot formed, not on the bar that reported it. - The padding is a multiple of ATR, so the label clears the candle on any instrument and any timeframe.
- The list is capped. A label is an object, and an uncapped list of objects
is the one mistake that turns a good study into a slow chart. The
padtest matters too: until ATR has warmed up,pivotUp + padis absent, and a label with no price is not drawn but still counts as an object.
To put a label at a level rather than beside a bar, anchor it at the level:
draw.label(time, rangeHigh, "Range high"). A label's price is on the scale of
the pane the study draws in, so in a study with its own pane the anchor is an
oscillator reading, not a price.
Tooltips
A tooltip is text that appears while the pointer rests on an object. Labels and
boxes take one, through the tooltip argument when you create them or
draw.setTooltip() later. Lines and polylines do not: draw.line has no
tooltip argument (OS3002), and
draw.setTooltip given a line or a polyline is
OS3011. Write \n inside the text to start a
new line, in a tooltip or a caption.
The division of labour keeps a chart readable:
| Goes in the caption | Goes in the tooltip |
|---|---|
| What this is, in two or three words | The numbers behind it |
| The one value the eye needs | When it formed, and how old it is |
| Nothing that changes every bar | Anything that changes every bar |
This study marks every gap at the 09:15 open with a two-word caption, and keeps the numbers in the tooltip:
version 1
study("Opening gaps", overlay = true, precision = 2)

minGap = input(0.2, "Smallest gap, percent", min = 0, max = 10)
keep   = input(20, "Gaps to keep", min = 1, max = 250)

pad = atr(14) * 0.5

// The first bar of a trading day: a bar on a different IST date from the bar
// before it. On the oldest bar time[1] is absent, so it is never a gap.
newDay = not isNone(time[1]) and not date.isSameDay(time, time[1], "Asia/Kolkata")

var tags = []

if newDay and not isNone(pad)
    prev   = close[1]
    gapPct = (open - prev) / prev * 100

    if abs(gapPct) >= minGap
        up      = gapPct > 0
        caption = up ? "Gap up" : "Gap down"
        detail  = "Open " + text(open, 2) + "\nPrevious close " + text(prev, 2) +
                  "\nGap " + text(gapPct, 2) + " percent"

        push(tags, draw.label(time, up ? high + pad : low - pad, caption,
                              color = up ? lime : red, textColor = black, tooltip = detail))
        if size(tags) > keep
            draw.delete(shift(tags))
On the first bar of a day, close[1] is the last close of the previous
session, so the gap is measured against the close a trader saw the evening
before. The tooltip holds three lines of numbers; the caption stays two words. A
tooltip costs nothing visually, which makes it the place for the detail you were
tempted to put in the caption.
The language's own test for the first bar of a session is
session.isFirstBar. It needs the instrument's session hours, which the
/trading chart does not give the engine yet, so there it has no value and a
study built on it draws nothing. On NSE, BSE and MCX a new IST date is a new
session, so the date test above works on the chart today. See
Sessions and time.
When a label is the wrong tool
| What you want to show | Use | Not a label, because |
|---|---|---|
| A value the chart has on every bar | plot() | A label per bar is an object per bar saying what one column says, and a script holds at most 10,000 |
| An event on one bar | signal() | A marker has no handle, no cap and no deletion to get wrong |
| The current state of several readings | table() | A grid is pinned to a corner and does not move with price |
| A regime that spans bars | background() or barColor() | A regime has no price, so it has nothing to anchor to |
| A price band over a stretch of time | draw.box() | A box has the extent; a label at its corner is a caption, not the zone |
| A number you want to read later | print() | The log takes a value per bar without drawing anything |
The failure worth naming is the label per bar. It looks fine while you test on
two hundred bars and is unusable on a real chart: the labels overlap into a grey
band, the chart slows in proportion to the history loaded, and past 10,000
objects the script stops with OS5010. The
information was a plot all along. If you find yourself writing draw.label
outside an if, stop and ask what the plot would be.
The second is the label used as a dashboard. Six labels stacked above the last bar form a table that moves when price moves, covers the candles around it, and has to be repositioned as the instrument reprices. A table stays in the corner you pin it to, keeps its rows lined up, and takes the same number of lines to write.
Common mistakes
| Symptom | Cause | Fix |
|---|---|---|
| A marker is on the wrong side of the bar | at was left out, so it took the default "above" | State at on every call |
OS3003 on a signal call | at, shape or color depends on bar data | Use a literal or an input, or write two calls |
| A marker is missing on early bars | text(value, decimals) of an absent value is absent | Use a show helper that says "warming up" |
A marker reads RSI none | text(value) of an absent value is the string "none" | Test isNone() first |
| A marker appears and disappears during a bar | onUnconfirmed = true in the declaration | Remove it, or guard with bar.isConfirmed |
| A loop that should mark several things marks one | One call site makes at most one marker per bar | Draw an object per element instead |
| The label sits inside the candle | Anchored at high with no padding | Anchor at high + atr(14) * 0.5 |
| The label is several bars right of its pivot | Anchored at time on the bar that reported the pivot | Anchor at time[rightBars] |
| The chart slows as history loads, or the script stops with OS5010 | One label per bar, or an uncapped list | Cap the list, or use a plot |
| A label is bare white text | No color, so the label has no plate | Pass a plate colour |
| A study that marks the session open draws nothing on the /trading chart | It tests session.isFirstBar, which has no value there | Test for a new IST date, as the gaps study does |
| OS2003 on the marker text | A number joined to a string | Convert it with text(value, decimals) |
Related. Lines and boxes for the
anchoring and lifecycle rules every label shares, Tables
for the dashboard a stack of labels is trying to be,
Bar colouring and backgrounds for
marking a stretch of bars, Colors for plate and text
colours, and the reference entries signal() and draw.label().