
Series functions
The functions that read a series across bars. Window highs and lows, changes and crossings, counters, remembered values, running totals, swing pivots and window statistics, each with the exact bar it first has a value on.
On this page
A series is a value with one entry per bar, such as close, volume or any name you assign at the top level of a script. The functions on this page read a series across bars rather than on one bar: the highest high of the last 20 bars, whether a fast average has just crossed a slow one, how many bars have passed since a breakout, the low at the last swing. Nearly every study and strategy uses a few of them, and many of the indicators on Technical analysis are built from them.
Each one replaces a lookback you would otherwise write by hand with the history operator [n], and each states the exact bar on which it first has a value. Use this page to pick the right function and to understand what it returns on the first bars of a chart, on a bar where an input is missing, and on a tie. Bars and history covers the history operator itself.
version 1
study("Twenty bar breakout", overlay = true, precision = 2)

len = input(20, "Lookback, in bars", min = 2, max = 200)

// The high and low of the previous len bars. The [1] leaves this bar out,
// so a close above upper is a close above every earlier high in the window.
upper = highest(high, len)[1]
lower = lowest(low, len)[1]

breakUp   = crossUp(close, upper)
breakDown = crossDown(close, lower)

// The level of the most recent upside break, and how many bars ago it was.
lastBreak = valueWhen(breakUp, upper)
barsAfter = barsSince(breakUp)

plot(upper, "Upper", lime, style = "step")
plot(lower, "Lower", red, style = "step")
plot(barsAfter <= 10 ? lastBreak : none, "Recent breakout level", orange, style = "step")

if breakUp
    signal("BREAK UP", at = "below", shape = "triangleUp")
if breakDown
    signal("BREAK DOWN", at = "above", shape = "triangleDown")
On a 15 minute chart of an NSE stock, the 09:15 to 15:30 session is 25 bars, so a lookback of 25 is a rolling window of exactly one session. The breakout level shows on the breakout bar and the ten bars after it, and then disappears, because barsAfter <= 10 is false after that and the plot receives none.
Rules every function here follows
| Rule | What it means for your script |
|---|---|
| The window includes this bar | highest(high, 20) covers this bar and the 19 before it. Add [1] to compare against the bars before this one |
| Warmup is exact | Warmup is the run of bars at the start of the chart before a call has enough history. Before the bar shown under First value, a call returns none, the absent value, and a plot draws a gap |
| One absent bar makes a window absent | If any bar in the window is absent, the result is absent. sumSkip(), avgSkip() and countPresent() are the exceptions, and count() counts an absent condition as not true |
| A length is a whole number of 1 or more | Any other value stops the script on that bar |
| Each call keeps its own state | Compute at the top level of the script, on every bar |
The window includes this bar
A window of length len is this bar and the len - 1 bars before it. That matters most for breakouts. close > highest(high, 20) can never be true, because the window holds this bar's own high and a close is never above its own bar's high. Compare against the window that ended on the previous bar instead: close > highest(high, 20)[1]. The [1] costs one bar of warmup, so the first value moves from bar 19 to bar 20.
First values and absence
The First value line of each entry counts the oldest bar on the chart as bar 0. "Bar len - 1" means the call is absent on bars 0 to len - 2 and has a value from bar len - 1 on. Warmups add up when you feed one call into another: highest(ema(close, 10), 20) first has a value on bar 9 + 19 = bar 28. Warmup shows how to count a chain.
Absence inside a window spreads to the result. A study that reads another instrument, or a value you set to none on some bars on purpose, produces a gap for as long as the absent bar sits inside the window. When you want the window to pass over absent bars, use the three functions under Totals that skip absent bars.
Lengths
A length (len, left, right, n) must be a whole number of 1 or more. A fractional, zero or negative length stops the script on that bar with run-time error OS4003, naming the function, the argument and the value it received. It is never rounded for you, because a length of 14.5 is a mistake in the script. When a length is computed, make it whole and keep it at 1 or above:
version 1
study("Half the setting")

len  = input(21, "Length", min = 2, max = 200)
half = max(1, round(len / 2))

plot(highest(high, half), "High over half the window", lime)
A length can be an input() or even a series that changes from bar to bar. When the length changes, the call starts its window again: it is absent until it has seen len bars at the new length, and then continues normally. highest(high, n) with n stepping from 20 to 30 is absent for 29 bars, starting on the bar of the step, and has a value again on the 30th.
Where to call them
Every function on this page keeps state between bars, so each carries a Keeps state badge. The state belongs to the place the call is written: two calls of highest(high, 20) in two places are two separate windows.
A call that does not run on a bar does not see that bar. So a call inside an if block skips the bars where the condition was false, and its window is no longer "the last 20 bars" but "the last 20 bars on which the block ran". The compiler warns about it with OS8001:
trending = close > ema(close, 50)
if trending
    // Runs only on trending bars, so the window leaves the other bars out.
    prevTop = highest(high, 20)[1]
    if close > prevTop
        signal("BREAKOUT", at = "below", shape = "triangleUp")
Compute first, on every bar, and decide afterwards:
version 1
study("Compute first, decide after", overlay = true)

trending = close > ema(close, 50)
prevTop  = highest(high, 20)[1]

if trending and close > prevTop
    signal("BREAKOUT", at = "below", shape = "triangleUp")
Execution model explains in full how each call keeps its own state.
Window highs and lows
highest()
The largest value of src over the last len bars, this bar included. Use it for a breakout level, the top of a channel, or the high of a range you want to trade out of.
highest(src: series number, len: number) -> series number| Parameter | Type | Default | Notes |
|---|---|---|---|
src | series number | required | |
len | number | required |
- Returns
series number- First value
- bar
len - 1
version 1
study("Previous 20 bar high", overlay = true)

prevHigh = highest(high, 20)[1]
plot(prevHigh, "Previous 20 bar high", lime, style = "step")

if close > prevHigh
    barColor(lime)
Remarks. The window includes this bar, so compare a close against highest(high, len)[1], as above, not against highest(high, len). If any bar in the window is absent, the result is absent for as long as that bar stays in the window.
See also. lowest(), highestBars(), donchian()
lowest()
The smallest value of src over the last len bars, this bar included. Use it for the bottom of a range, a support level, or a stop below recent lows.
lowest(src: series number, len: number) -> series number| Parameter | Type | Default | Notes |
|---|---|---|---|
src | series number | required | |
len | number | required |
- Returns
series number- First value
- bar
len - 1
version 1
study("Stop under the last ten lows", overlay = true)

stopLine = lowest(low, 10)
plot(stopLine, "Ten bar low", red, style = "step")

if close < lowest(low, 10)[1]
    signal("BELOW THE RANGE", at = "above", shape = "arrowDown")
Remarks. A stop taken from lowest moves down as well as up. For a trailing stop that only rises, keep it in a var and raise it with max(); Persistence shows the pattern.
See also. highest(), lowestBars(), donchian()
highestBars()
How many bars ago the highest value in the window was set: 0 when this bar set it, up to len - 1 when the oldest bar in the window did. Use it to ask how fresh a high is, or to find the bar a high was made on.
highestBars(src: series number, len: number) -> series number| Parameter | Type | Default | Notes |
|---|---|---|---|
src | series number | required | |
len | number | required |
- Returns
series number- First value
- bar
len - 1
version 1
study("Fresh 50 bar high", overlay = true)

age = highestBars(high, 50)
plot(highest(high, 50), "50 bar high", lime, style = "step")

if age == 0
    signal("NEW HIGH", at = "above", shape = "circle")
Remarks. A tie goes to the most recent bar: when the same high is touched twice inside the window, the count is to the later touch. The result is a whole number of bars, so it works as an offset: close[highestBars(high, 50)] is the close on the bar that set the high, and time[highestBars(high, 50)] is that bar's time, which is where a drawing anchored to the high belongs.
See also. highest(), lowestBars(), barsSince()
lowestBars()
How many bars ago the lowest value in the window was set: 0 when this bar set it. Use it to anchor a label or a line at the low of a range.
lowestBars(src: series number, len: number) -> series number| Parameter | Type | Default | Notes |
|---|---|---|---|
src | series number | required | |
len | number | required |
- Returns
series number- First value
- bar
len - 1
version 1
study("Where the 20 bar low was", overlay = true)

age      = lowestBars(low, 20)
lowTime  = time[age]
lowPrice = low[age]

if bar.isLast
    draw.label(lowTime, lowPrice, "20 bar low", color = red)
Remarks. Ties go to the most recent bar, as with highestBars(). During the first len - 1 bars the result is absent, and so is any value read through it, such as low[age] above.
See also. lowest(), highestBars(), draw.label()
Change and direction
change()
How much src has moved: src - src[1] with one argument, and src - src[len] with two. Use it for a bar's change, a change over a week of daily bars, or as the input to another function.
change(src: series number) -> series number
change(src: series number, len: number) -> series number| Parameter | Type | Default | Notes |
|---|---|---|---|
src | series number | required | |
len | number | required |
- Returns
series number- First value
- bar 1
version 1
study("Change over one bar and five", precision = 2)

plot(change(close), "Change on the bar", gray, style = "histogram")
plot(change(close, 5), "Change over five bars", aqua)
Remarks. On a daily NSE chart, five bars is a trading week. The one argument form has its first value on bar 1; the two argument form has it on bar len, because it needs the bar len bars back. For a percentage, divide by the earlier value, change(close, 5) / close[5] * 100, or use roc().
rising()
True when src went up on each of the last len bars: every one of the last len one bar changes was above zero. Use it to confirm that an average or an oscillator is climbing, not just above a level.
rising(src: series number, len: number) -> series bool| Parameter | Type | Default | Notes |
|---|---|---|---|
src | series number | required | |
len | number | required |
- Returns
series bool- First value
- bar
len
version 1
study("Direction of the average", overlay = true)

ema20 = ema(close, 20)
up    = rising(ema20, 3)
down  = falling(ema20, 3)

plot(ema20, "EMA 20", orange)

if up
    barColor(lime)
else if down
    barColor(red)
Remarks. The test is strict: a bar on which src did not change breaks the run, so a flat value is neither rising nor falling. The first value is on bar len, one bar later than a window of len values, because len changes need len + 1 bars. The example computes both tests before the if: written inside the else if, falling would only see the bars where rising was false, and the compiler warns with OS8001.
falling()
True when src went down on each of the last len bars. Use it to spot a pullback, a fading oscillator or a weakening average.
falling(src: series number, len: number) -> series bool| Parameter | Type | Default | Notes |
|---|---|---|---|
src | series number | required | |
len | number | required |
- Returns
series bool- First value
- bar
len
version 1
study("Pullback in an uptrend", overlay = true)

trendUp  = close > ema(close, 50)
pullback = falling(close, 3)

if trendUp and pullback
    signal("PULLBACK", at = "below", shape = "triangleUp")
Remarks. Strict in the same way as rising(): an unchanged bar ends the run. Absent on the first len bars, so an if on it simply does not run there.
Crossings
crossUp()
True on the bar where a moves above b: on the previous bar a was at or below b, and on this bar it is above. Use it for a moving average crossover, a price crossing a level, or an oscillator leaving an oversold zone.
crossUp(a: series number, b: series number) -> series bool| Parameter | Type | Default | Notes |
|---|---|---|---|
a | series number | required | |
b | series number | required |
- Returns
series bool- First value
- bar 1
version 1
study("EMA 9 and 21 cross", overlay = true)

fast = ema(close, 9)
slow = ema(close, 21)

plot(fast, "EMA 9", aqua)
plot(slow, "EMA 21", orange)

if crossUp(fast, slow)
    signal("BUY", at = "below", shape = "arrowUp")
"At or below, then above" means two lines that touch and then separate count as one crossing. Here is a close crossing a fixed level of 102:
| Bar | close | crossUp(close, 102) |
|---|---|---|
| 1 | 101 | false |
| 2 | 102 | false, the close only touched the level |
| 3 | 103 | true, it was at the level and is now above |
Remarks. Either argument can be a fixed number: crossUp(rsi(close, 14), 30). The first value is on bar 1. The result is absent when either side is absent on this bar or on the previous one, which happens during an indicator's warmup, so the first crossing a script can see comes one bar after both sides have values.
See also. crossDown(), cross(), valueWhen()
crossDown()
True on the bar where a moves below b: on the previous bar a was at or above b, and on this bar it is below. Use it for a bearish crossover, a price losing a level, or an oscillator leaving an overbought zone.
crossDown(a: series number, b: series number) -> series bool| Parameter | Type | Default | Notes |
|---|---|---|---|
a | series number | required | |
b | series number | required |
- Returns
series bool- First value
- bar 1
version 1
study("RSI leaves overbought", precision = 2)

r = rsi(close, 14)
plot(r, "RSI 14", purple)
level(70, "Overbought", red)

if crossDown(r, 70)
    signal("EXIT", at = "above", shape = "arrowDown")
Remarks. The mirror of crossUp(), with the same rule for touching: a value that falls to exactly b has not crossed yet, and crosses on the bar it goes below.
cross()
True when a crosses b in either direction on this bar. Use it when the direction does not matter, such as an alert whenever price crosses VWAP.
cross(a: series number, b: series number) -> series bool| Parameter | Type | Default | Notes |
|---|---|---|---|
a | series number | required | |
b | series number | required |
- Returns
series bool- First value
- bar 1
version 1
study("Price crosses VWAP", overlay = true)

// The day's VWAP, restarted on the first bar of each IST day.
newDay = isNone(time[1]) or not date.isSameDay(time, time[1], "Asia/Kolkata")
v = vwapAnchor(hlc3, newDay)
plot(v, "VWAP", orange)

if cross(close, v)
    signal("X", at = "price", shape = "circle")
    alert("Price crossed VWAP", id = "vwap-cross")
Remarks. cross(a, b) is the same as crossUp(a, b) or crossDown(a, b). When you later need to know which way it went, test the two directions separately. The example anchors the average by date because vwap() restarts on the session's first bar, which needs session hours the /trading chart does not state in this release.
See also. crossUp(), crossDown(), alert()
Counting and remembering
barsSince()
How many bars have passed since cond was last true: 0 on a bar where it is true, 1 on the bar after, and so on. Use it to act within a few bars of an event, or to measure how long a quiet spell has lasted.
barsSince(cond: series bool) -> series number| Parameter | Type | Default | Notes |
|---|---|---|---|
cond | series bool | required |
- Returns
series number- First value
- first bar
condis true
version 1
study("Bars since a wide range bar", precision = 0)

wide = (high - low) > 2 * atr(14)
plot(barsSince(wide), "Bars since a wide bar", teal, style = "column")
Remarks. The result is absent, not zero, until cond has been true at least once, because zero would read as "it happened on this bar". A test such as barsSince(breakout) <= 5 is therefore absent before the first breakout, and an if on it does not run, which is the answer you want. After that, a bar where cond is absent counts as a bar where it was not true, so the count keeps rising.
See also. valueWhen(), count(), highestBars()
valueWhen()
The value src had on the most recent bar where cond was true, held until cond is true again. With occurrence = 1 it reaches one event further back, to the true bar before that one. Use it to remember a price at an event: the low at the last crossover, the high of the last breakout bar.
valueWhen(cond: series bool, src: T, occurrence?: number = 0) -> T| Parameter | Type | Default | Notes |
|---|---|---|---|
cond | series bool | required | |
src | T | required | |
occurrence | number | 0 |
- Returns
T- First value
- the
occurrence + 1th true bar
version 1
study("Low at the last two crossovers", overlay = true)

fast    = ema(close, 9)
slow    = ema(close, 21)
crossed = crossUp(fast, slow)

lastLow  = valueWhen(crossed, low)
priorLow = valueWhen(crossed, low, 1)

plot(lastLow, "Low at the last cross", lime, style = "step")

if crossed and lastLow > priorLow
    signal("HIGHER LOW", at = "below")
Remarks. occurrence = 0 is the most recent true bar, 1 the one before it, and so on. The result is absent until cond has been true occurrence + 1 times. An absent cond counts as not true. occurrence must be a whole number, 0 or more; a fraction or a negative number gives none on every bar rather than stopping the script.
See also. barsSince(), pivotLow(), Persistence
count()
How many of the last len bars cond was true on, this bar included, from 0 to len. Use it to measure how persistent a condition is: up bars in a window, closes above an average, bars with heavy volume.
count(cond: series bool, len: number) -> series number| Parameter | Type | Default | Notes |
|---|---|---|---|
cond | series bool | required | |
len | number | required |
- Returns
series number- First value
- bar
len - 1
version 1
study("Up bars in the last 20", precision = 0)

upBars = count(close > open, 20)
plot(upBars, "Up bars", lime, style = "column")
level(10, "Half", gray)
Remarks. An absent condition counts as not true rather than making the result absent. So count(close > close[1], 20) has a value from bar 19 even though its condition is absent on bar 0. Divide by len and multiply by 100 for a percentage of the window.
See also. barsSince(), sum(), rising()
history()
src as it stood n bars ago: the call form of src[n]. It takes an expression directly, so history(close - open, 1) is the previous bar's body without naming it first.
history(src: T, n: number) -> T| Parameter | Type | Default | Notes |
|---|---|---|---|
src | T | required | |
n | number | required |
- Returns
T- First value
- bar
n
version 1
study("Body against the previous body", precision = 2)

plot(close - open, "Body", aqua, style = "histogram")
plot(history(close - open, 1), "Previous body", orange)
Remarks. The first value is on bar n. Unlike the offset inside [], n is a length: a whole number of 1 or more, so history(close, 0) stops the script with OS4003 where close[0] simply reads this bar. Bars and history covers when to prefer a named value.
See also. change(), valueWhen()
Running totals
cum()
The running total of src from the first bar. Use it for a line that accumulates for the whole chart, such as a score of up bars against down bars.
cum(src: series number) -> series number| Parameter | Type | Default | Notes |
|---|---|---|---|
src | series number | required |
- Returns
series number- First value
- bar 0
version 1
study("Up bars minus down bars", precision = 0)

score = close > open ? 1 : close < open ? -1 : 0
plot(cum(score), "Running score", aqua)
Remarks. An absent bar gives an absent result on that bar and leaves the total where it was; the next present bar carries on from there. The total never restarts. For a total that restarts every session at 09:15, keep it in a var and reset it on the session's first bar, as Persistence shows: session.isFirstBar where the host states session hours, and a new IST date on the /trading chart, which does not.
sum()
The total of src over the last len bars, this bar included. A second form, sum(arr), totals every element of an array. The compiler picks the form from the arguments you pass.
sum(src: series number, len: number) -> series number
sum(arr: array<number>) -> number| Parameter | Type | Default | Notes |
|---|---|---|---|
src | series number | required | |
len | number | required | |
arr | array<number> | required |
- Returns
series number | number- First value
- bar
len - 1
version 1
study("Net move over 20 bars", precision = 2)

move = close - open
plot(sum(move, 20), "Sum of bodies, 20 bars", aqua)
The array form reads every element once:
version 1
study("Average of three levels", overlay = true)

levels = [22000.0, 22500.0, 23000.0]
plot(sum(levels) / size(levels), "Average level", orange)
Remarks. In the window form, one absent bar in the window makes the total absent; use sumSkip() to pass over absent bars. In the array form, an empty array totals 0 and an array holding an absent element totals none. A single series with no length matches neither form:
plot(sum(close), "Total")Totals that skip absent bars
Every other window function on this page gives none when any bar in its window is absent. These three pass over absent bars instead, and say so in their names. Use them for a series that is absent on some bars by design: a value that only exists on the first bar of each session, a reading taken only on up bars, or another instrument's data with gaps in it.
sumSkip()
The total of the present values of src over the last len bars, passing over absent bars. A window with no present values totals 0.
sumSkip(src: series number, len: number) -> series number| Parameter | Type | Default | Notes |
|---|---|---|---|
src | series number | required | |
len | number | required |
- Returns
series number- First value
- bar
len - 1
version 1
study("Up moves and down moves", precision = 2)

upMove   = close > open ? close - open : none
downMove = close < open ? open - close : none

plot(sumSkip(upMove, 20), "Up moves in 20 bars", lime)
plot(sumSkip(downMove, 20), "Down moves in 20 bars", red)
Remarks. The first value is on bar len - 1, even when the early bars are all absent. Because an empty window totals 0, a zero can mean "nothing present" as well as "the values added to zero"; check countPresent() when the difference matters.
See also. sum(), avgSkip(), countPresent()
avgSkip()
The mean of the present values of src over the last len bars, passing over absent bars. It divides by the number of bars that had a value, not by len.
avgSkip(src: series number, len: number) -> series number| Parameter | Type | Default | Notes |
|---|---|---|---|
src | series number | required | |
len | number | required |
- Returns
series number- First value
- bar
len - 1
version 1
study("Average up body and down body", precision = 2)

upBody   = close > open ? close - open : none
downBody = close < open ? open - close : none

plot(avgSkip(upBody, 50), "Average up body", lime)
plot(avgSkip(downBody, 50), "Average down body", red)
Remarks. A window with no present values has no mean, so the result is absent there. Read it beside countPresent(): an average of three bars out of fifty is a much weaker number than an average of forty.
See also. sma(), sumSkip(), countPresent()
countPresent()
How many of the last len bars had a value for src, from 0 to len. Use it to see how much data an avgSkip() or sumSkip() reading was built from.
countPresent(src: series number, len: number) -> series number| Parameter | Type | Default | Notes |
|---|---|---|---|
src | series number | required | |
len | number | required |
- Returns
series number- First value
- bar
len - 1
version 1
study("Opening gaps in the window", precision = 2)

window = input(250, "Window, in bars", min = 2, max = 5000)

// The session's first bar, or of the IST day where no session hours are stated.
newSession = orElse(session.isFirstBar, isNone(time[1]) or not date.isSameDay(time, time[1], "Asia/Kolkata"))

// A gap exists only on the first bar of each session and is absent elsewhere.
gap = newSession ? open - close[1] : none

plot(avgSkip(gap, window), "Average opening gap", orange)
plot(countPresent(gap, window), "Session opens in the window", silver)
Remarks. On a 15 minute NSE chart, 250 bars is ten sessions, so the second line reads about 10. A count well below what you expect points to missing data rather than a quiet market.
Swing pivots
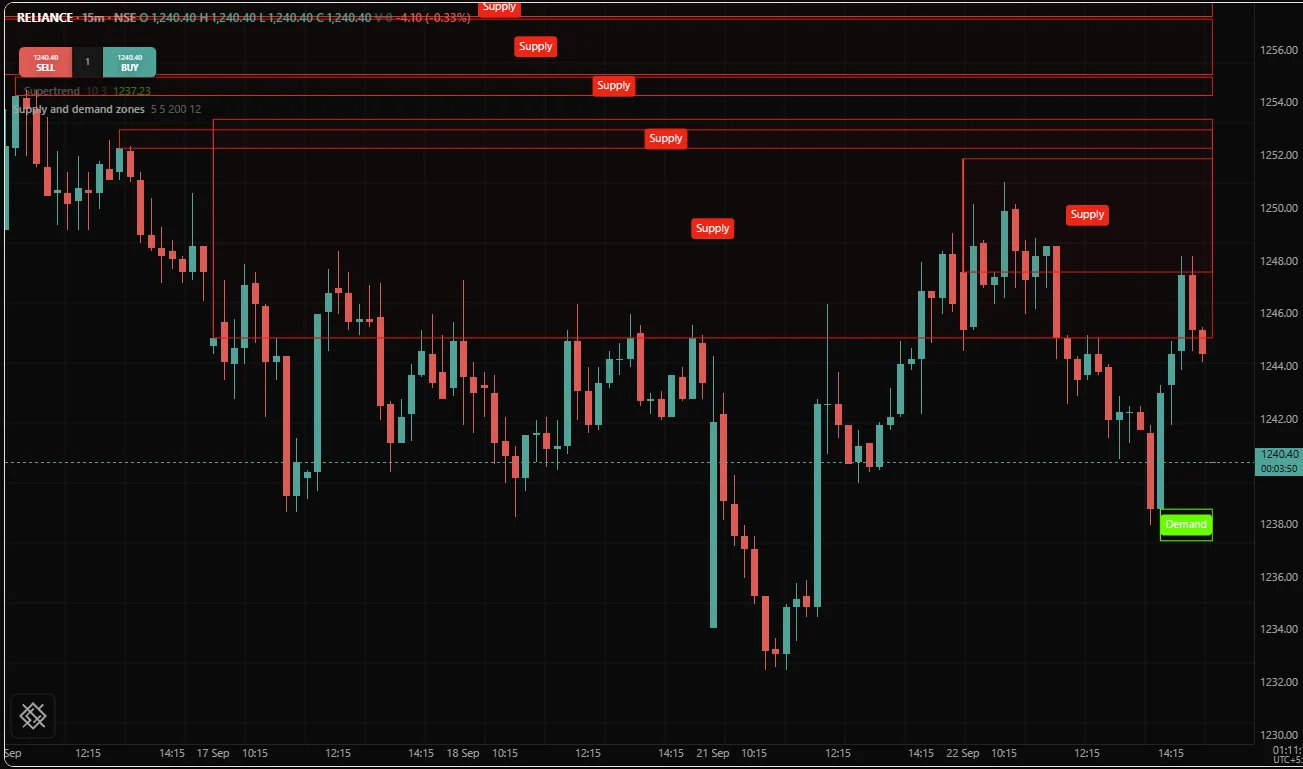
A pivot is a swing high or swing low: a bar that stands above, or below, a set number of bars on each side of it. Pivots anchor divergences, trendlines and supply and demand zones. The chart below shows a supply and demand study on a 15 minute NSE chart: it finds each zone with pivotHigh() and pivotLow(), five bars on each side, and draws it with draw.box().
pivotHigh()
The value of a swing high: a bar whose src is higher than each of the left bars before it and each of the right bars after it. The value is reported on the bar right bars after the pivot, which is the first bar on which the pivot is known, and the result is absent on every other bar.
pivotHigh(src: series number, left: number, right: number) -> series number| Parameter | Type | Default | Notes |
|---|---|---|---|
src | series number | required | |
left | number | required | |
right | number | required |
- Returns
series number- First value
- bar
left + right
version 1
study("Swing highs and lows", overlay = true)

// Five bars on each side. Each pivot is known five bars after it forms.
ph = pivotHigh(high, 5, 5)
pl = pivotLow(low, 5, 5)

// offset draws the marker back on the pivot bar without changing the bar on
// which the value became known.
plot(ph, "Swing high", red, style = "lineWithMarkers", offset = -5)
plot(pl, "Swing low", lime, style = "lineWithMarkers", offset = -5)
Remarks. The comparison is strict on both sides, so a run of equal highs holds no pivot. The report comes right bars late on purpose: a value placed back on the pivot bar would be a value no script could have had at that time, and the study would look better on history than it can ever be on the latest bar. To draw at the pivot, shift the plot with offset set to minus right, or anchor a drawing object at time[right] and high[right]. A plot's offset must be a fixed number or a single input(), so write the number, as above, rather than an expression such as -right. A strategy that acts on a pivot acts right bars after it.
See also. pivotLow(), highestBars(), zigzag()
pivotLow()
The value of a swing low: a bar whose src is lower than each of the left bars before it and each of the right bars after it, reported right bars later and absent on every other bar.
pivotLow(src: series number, left: number, right: number) -> series number| Parameter | Type | Default | Notes |
|---|---|---|---|
src | series number | required | |
left | number | required | |
right | number | required |
- Returns
series number- First value
- bar
left + right
version 1
study("Last swing low as support", overlay = true)

pl      = pivotLow(low, 3, 3)
support = valueWhen(not isNone(pl), pl)

plot(support, "Last swing low", lime, style = "step")

if crossDown(close, support)
    signal("SUPPORT BROKEN", at = "above", shape = "arrowDown")
Remarks. Because the result is absent between pivots, hold the last one with valueWhen(), as above, or in a var. The line steps to each new swing low right bars after the low was made.
See also. pivotHigh(), lowestBars(), valueWhen()
Window statistics
These five describe the distribution of values inside a window. Each is computed fresh over the window on every bar, and each is absent while any bar in the window is absent.
median()
The middle value of src over the last len bars. With an even len it is the mean of the two middle values. Use it as a centre line that one extreme bar cannot drag far.
median(src: series number, len: number) -> series number| Parameter | Type | Default | Notes |
|---|---|---|---|
src | series number | required | |
len | number | required |
- Returns
series number- First value
- bar
len - 1
version 1
study("Median and mean close", overlay = true)

plot(median(close, 21), "Median 21", orange)
plot(sma(close, 21), "Mean 21", aqua)
Remarks. A single outlier, such as a result day spike, moves the mean by its full size divided by len but barely moves the median. median(src, len) is exactly percentile(src, len, 50).
See also. percentile(), sma()
percentile()
The value below which p percent of the window falls, from p = 0, the window's lowest value, to p = 100, its highest. Between two values it interpolates in a straight line. Use it for a threshold that adapts to the instrument, such as "a range larger than 80 percent of recent bars".
percentile(src: series number, len: number, p: number) -> series number| Parameter | Type | Default | Notes |
|---|---|---|---|
src | series number | required | |
len | number | required | |
p | number | required |
- Returns
series number- First value
- bar
len - 1
version 1
study("Bar range against its own history", precision = 2)

barRange = high - low
plot(barRange, "Bar range", silver, style = "column")
plot(percentile(barRange, 100, 80), "80th percentile", red)
plot(percentile(barRange, 100, 20), "20th percentile", lime)
Remarks. The window's values are sorted, and the result sits at position p / 100 * (len - 1) in that order. For the four values 10, 20, 30 and 40, the 25th percentile is at position 0.75, three quarters of the way from 10 to 20, which is 17.5. A p outside 0 to 100 gives none.
See also. median(), percentRank()
percentRank()
Where this bar's value stands in its own window, as a percentage: the share of the last len values, this one included, that are at or below it. 100 means nothing in the window is higher. Use it to rank today's close, range or volume against recent history on a common 0 to 100 scale.
percentRank(src: series number, len: number) -> series number| Parameter | Type | Default | Notes |
|---|---|---|---|
src | series number | required | |
len | number | required |
- Returns
series number- First value
- bar
len - 1
version 1
study("Close rank over a year", precision = 0, range = [0, 100])

plot(percentRank(close, 250), "Rank of the close", teal)
level(90, "Top tenth", red)
level(10, "Bottom tenth", lime)
Remarks. On a daily chart, 250 bars is about one year of NSE sessions. Because this bar counts itself, the lowest possible reading is 100 / len, not 0: in a window of 4 the lowest value reads 25. Equal values count as at or below, so a close that ties the window's high reads 100.
See also. percentile(), highest()
correlation()
The correlation of a and b over the last len bars, from -1 (they move in opposite directions) through 0 (no linear relation) to 1 (they move together). Use it to see how closely a stock is following its index, or whether two instruments are still paired.
correlation(a: series number, b: series number, len: number) -> series number| Parameter | Type | Default | Notes |
|---|---|---|---|
a | series number | required | |
b | series number | required | |
len | number | required |
- Returns
series number- First value
- bar
len - 1
version 1
study("Correlation with NIFTY", precision = 2, range = [-1, 1])

benchName     = input("NIFTY", "Benchmark symbol")
benchExchange = input("NSE_INDEX", "Benchmark exchange")
len           = input(60, "Window, in bars", min = 2, max = 500)

// "developing" reads the benchmark's bar at the same instant as the chart's
// bar. The default, "confirmed", would hand back the benchmark's previous
// bar, and the two returns below would be one bar apart.
bench = req.symbol(benchName, chart.interval, close, exchange = benchExchange, mode = "developing")

// Correlate bar to bar returns rather than prices: two prices that both
// rose over the window correlate strongly even when their bar to bar moves
// do not.
stockRet = change(close) / close[1]
benchRet = change(bench) / bench[1]

plot(correlation(stockRet, benchRet, len), "Correlation", aqua)
level(0, "Zero", gray)
Remarks. This is the population correlation: the covariance() divided by the product of the two population standard deviations, each of which divides by len rather than len - 1. When either series is flat across the window its spread is zero, and the result is none.
Pairing two instruments bar by bar needs both values from the same bar. A read at the chart's own interval in the default "confirmed" mode only ever holds bars that have closed, and at the open of a chart bar the other instrument's bar at the same instant has not closed yet, so the read is one bar behind the chart. mode = "developing" removes that lag. On the bars already on the chart it gives each bar's final value, and on the newest bar it moves with the market, exactly as the chart's own close does. Higher timeframes explains the modes.
Any bar the benchmark has not supplied is absent and leaves a gap until it has left the window. On a daily chart in /trading, write "1D" as the timeframe in place of chart.interval. Other instruments covers both.
See also. covariance(), req.symbol(), stdev()
covariance()
The population covariance of a and b over the last len bars: the average product of their distances from their own means. Positive when they move together, negative when they move apart. Its size is in the units of a times the units of b, so read the sign more than the number; correlation() is the scaled version.
covariance(a: series number, b: series number, len: number) -> series number| Parameter | Type | Default | Notes |
|---|---|---|---|
a | series number | required | |
b | series number | required | |
len | number | required |
- Returns
series number- First value
- bar
len - 1
version 1
study("Beta against NIFTY", precision = 2)

benchName     = input("NIFTY", "Benchmark symbol")
benchExchange = input("NSE_INDEX", "Benchmark exchange")
len           = input(120, "Window, in bars", min = 2, max = 1000)

// The benchmark's bar at the same instant as the chart's, as in the
// correlation example above.
bench = req.symbol(benchName, chart.interval, close, exchange = benchExchange, mode = "developing")

stockRet = change(close) / close[1]
benchRet = change(bench) / bench[1]

// Beta: how far the stock moved, on average, for each unit the index moved.
beta = covariance(stockRet, benchRet, len) / covariance(benchRet, benchRet, len)

plot(beta, "Beta", orange)
level(1, "Moves with the index", gray)
Remarks. The covariance of a series with itself, covariance(x, x, len), is the population variance of x, the square of stdev(x, len). Population form means it divides by len, not len - 1.
See also. correlation(), variance(), stdev()
Related
Bars and history, Warmup, Absent values, Execution model, Technical analysis, Math, Other instruments