
Tables
table() and cell(), the grid a study pins to a corner of its pane for readings that are one current state rather than a value per bar, with every argument and the rules for writing it.
Most of what a study computes is a value per bar, and a value per bar is a plot(). A table is for the rest: the current RSI, ATR and volume in one glance, the trend on three timeframes, today's range, the symbol and interval. OpenScript (also called OpenAlgo Script) declares a table with table(), a grid pinned to a corner of the pane, and fills it with cell(). The grid stays in its corner while the chart scrolls and zooms, and it sits over whatever candles are behind it.
version 1
study("Readings", overlay = true, precision = 2)

corner = input("bottomRight", "Corner", options = ["topLeft", "topRight", "bottomLeft", "bottomRight"])

// Declared once, at the top level, like a plot.
panel = table("Readings", 4, 2, position = corner, textColor = silver, bgColor = fade(black, 25))

// Every reading is computed on every bar, outside the if below.
r = rsi(close, 14)
a = atr(14)
volumeRatio = volume / sma(volume, 20)

fn show(value, decimals) => isNone(value) ? "warming up" : text(value, decimals)

// Written on the newest bar only: the panel shows one state, the current one.
if bar.isLast
    cell(panel, 0, 0, chart.symbol, textColor = white)
    cell(panel, 0, 1, chart.interval, textColor = white, align = "right")
    cell(panel, 1, 0, "RSI 14")
    cell(panel, 1, 1, show(r, 1), textColor = r > 70 ? red : r < 30 ? lime : silver, align = "right")
    cell(panel, 2, 0, "ATR 14")
    cell(panel, 2, 1, show(a, 2), align = "right")
    cell(panel, 3, 0, "Volume against its average")
    cell(panel, 3, 1, show(volumeRatio, 2), align = "right")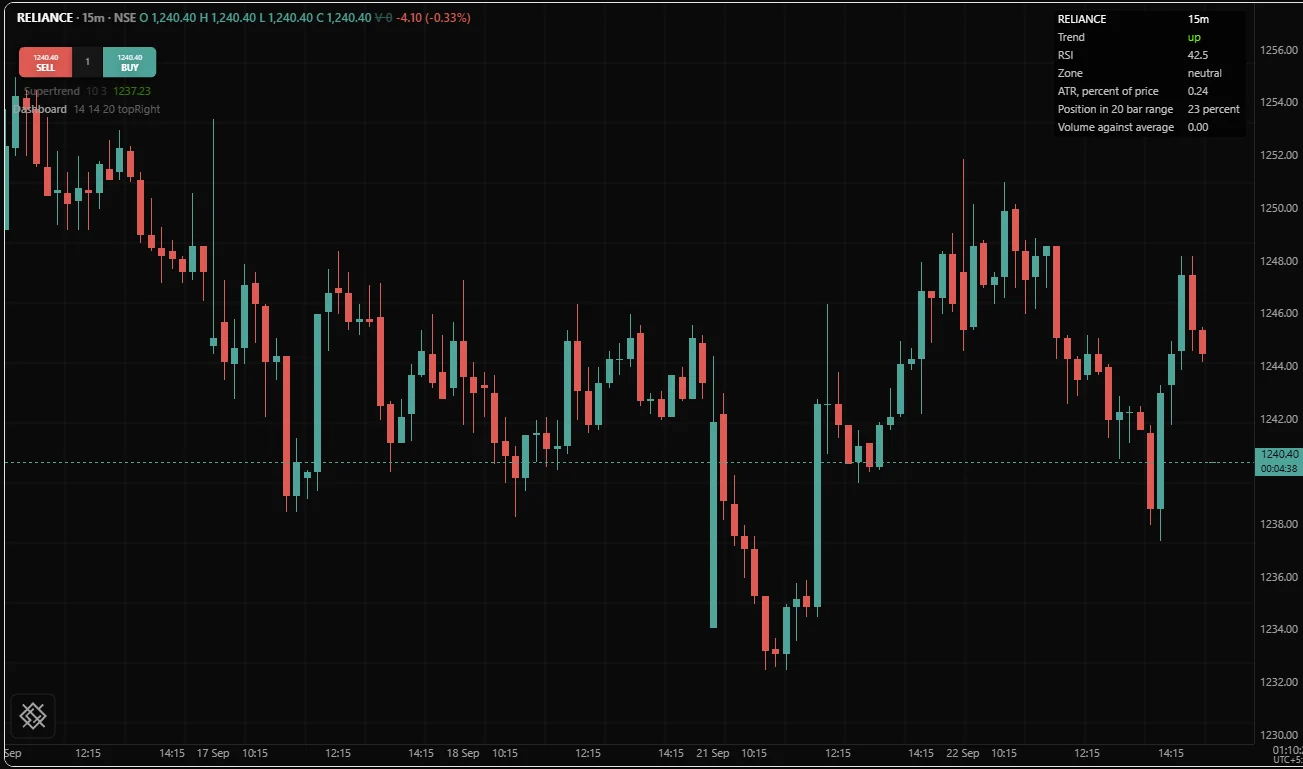
How a table works
table() | cell() | |
|---|---|---|
| Where it may appear | Top level only | Anywhere: inside an if, a loop or a function |
| When it happens | Once, before the first bar | On every bar where the call runs |
| Its arguments | All fixed before the first bar | All read on the bar it runs |
| Returns | A table, the same object on every bar | Nothing |
A grid starts every bar empty. What the chart shows is the cells written on the newest bar, and a cell written on an earlier bar does not carry over. That is why a panel is written inside if bar.isLast (bar.isLast is true only on the newest bar): writing it on every bar of a long history is thousands of writes to show the last one. On a moving chart the newest bar runs again on every update and the grid is rewritten each time, so nothing piles up.
Compute at the top level, write inside the if. An indicator such as rsi() keeps state and advances only on the bars where its call runs. Moved inside if bar.isLast, it would see one bar and return none, and the compiler warns with OS8001.
Cells hold text. The text argument is a string, and a number passed there is error OS3011, so convert it with text(). A text that is none leaves the cell blank. Because a condition that is none takes the false branch, b ? "up" : "down" says "down" on every bar before b has a value; test isNone() first and say "warming up".
Addresses start at zero. A grid of 4 rows and 2 columns has rows 0 to 3 and columns 0 to 1. Writing outside the grid is error OS4004, which stops the script on that bar.
Colour has three levels. The grid's textColor and bgColor apply to every cell that says nothing else; a cell's own textColor and bgColor override them for that cell; leave both out and the chart's defaults apply. Give the grid a translucent background, such as fade(black, 25), so the candles behind it stay faintly visible.
On the /trading chart, one grid per study is drawn. A study may declare several grids and the compiler accepts them, but the chart draws only the first one declared; the others compile, are written to and never appear. The grid's title is not shown on the chart either. Declare one grid with the rows you need, and write a second study for a second panel.
Declaring a grid
table()
Declares a grid of rows by cols cells pinned to one corner of the study's pane, and returns the table that cell() writes into. The title names the grid; the size and corner are part of the study's fixed shape, which is why the call is top level only and every argument is settled before the first bar.
table(
    title: string,
    rows: number,
    cols: number,
    position?: string = "topRight",
    textColor?: color = none,
    bgColor?: color = none,
    borderWidth?: number = 0
) -> table| Parameter | Type | Default | Notes |
|---|---|---|---|
title | string | required | Fixed before the first bar |
rows | number | required | A whole number. Fixed before the first bar |
cols | number | required | A whole number. Fixed before the first bar |
position | string | "topRight" | One of "topLeft", "topRight", "bottomLeft", "bottomRight". Fixed before the first bar |
textColor | color | none | Fixed before the first bar |
bgColor | color | none | Fixed before the first bar |
borderWidth | number | 0 | Fixed before the first bar |
- Returns
table- First value
- bar 0
version 1
study("Timeframe bias", overlay = true)

tfA = input("15m", "Timeframe 1", kind = "interval")
tfB = input("1h",  "Timeframe 2", kind = "interval")
tfC = input("1D",  "Timeframe 3", kind = "interval")

grid = table("Bias", 4, 2, position = "topRight", bgColor = fade(black, 20), borderWidth = 1)

// Each row changes when that timeframe's bar closes, and not before.
// A timeframe finer than the chart's stops the study with OS6002, so run
// this on a chart of 15 minutes or less.
biasA = req.timeframe(tfA, ema(close, 20) > ema(close, 50))
biasB = req.timeframe(tfB, ema(close, 20) > ema(close, 50))
biasC = req.timeframe(tfC, ema(close, 20) > ema(close, 50))

fn word(b) => isNone(b) ? "warming up" : (b ? "up" : "down")
fn tint(b) => isNone(b) ? silver : (b ? lime : red)

if bar.isLast
    cell(grid, 0, 0, "Timeframe", textColor = white)
    cell(grid, 0, 1, "Bias", textColor = white, align = "right")
    cell(grid, 1, 0, tfA)
    cell(grid, 1, 1, word(biasA), textColor = tint(biasA), align = "right")
    cell(grid, 2, 0, tfB)
    cell(grid, 2, 1, word(biasB), textColor = tint(biasB), align = "right")
    cell(grid, 3, 0, tfC)
    cell(grid, 3, 1, word(biasC), textColor = tint(biasC), align = "right")
A table() inside an if, a loop or a function is error OS3006:
if bar.isLast
    panel = table("Readings", 2, 2)
Its arguments are fixed before the first bar, so write each one at the call as a literal, a colour such as fade(black, 25), or an input(). An argument that depends on bar data is error OS3003, and so is a size held in a name, such as n = 3 followed by table("Readings", n, 2).
Remarks. rows and cols are whole numbers; a fraction is error OS3004. Make position an input() with the four corners as options, since which corner is free depends on the reader's chart. The table is an ordinary value: you can name it, keep it and pass it to a function of your own, and it is never deleted. Writing no cells leaves every cell blank, but the grid keeps its size, its border and its own bgColor, so a grid with a background still shows as an empty block. For a panel the reader can switch off, leave the grid's bgColor and borderWidth out, set bgColor on the cells instead, and guard the writes with if bar.isLast and showPanel. A table with fifty rows of history works and is unreadable at the size of a chart corner; a list belongs in a report, not on the chart.
See also. cell(), clear(), bar.isLast, Tables
Writing cells
cell()
Writes one cell of the grid t at row and col on this bar, with its own text colour, background and alignment. The text is a string; the colours and the alignment are read on the bar, so a cell can change colour with the reading it shows.
cell(
    t: table,
    row: number,
    col: number,
    text: string,
    textColor?: color = none,
    bgColor?: color = none,
    align?: string = "left"
) -> nothing| Parameter | Type | Default | Notes |
|---|---|---|---|
t | table | required | |
row | number | required | A whole number |
col | number | required | A whole number |
text | string | required | |
textColor | color | none | |
bgColor | color | none | |
align | string | "left" | One of "left", "center", "right" |
- Returns
nothing- First value
- bar 0
version 1
study("Average ladder", overlay = true, precision = 2)

ladder = table("Averages", 5, 3, position = "bottomLeft", textColor = silver, bgColor = fade(black, 25))

e9   = ema(close, 9)
e21  = ema(close, 21)
e50  = ema(close, 50)
e200 = ema(close, 200)

// One row of the ladder: labels left, numbers right.
fn row(t, r, name, value) =>
    above = not isNone(value) and close > value
    cell(t, r, 0, name)
    cell(t, r, 1, isNone(value) ? "warming up" : text(value, 2), align = "right")
    cell(t, r, 2, isNone(value) ? "" : (above ? "above" : "below"), textColor = isNone(value) ? silver : (above ? lime : red), align = "right")
    above

if bar.isLast
    // A header: the same background across the row reads as one block.
    header = fade(navy, 40)
    cell(ladder, 0, 0, "Average", textColor = white, bgColor = header)
    cell(ladder, 0, 1, "Value", textColor = white, bgColor = header, align = "right")
    cell(ladder, 0, 2, "Close is", textColor = white, bgColor = header, align = "right")
    row(ladder, 1, "EMA 9", e9)
    row(ladder, 2, "EMA 21", e21)
    row(ladder, 3, "EMA 50", e50)
    row(ladder, 4, "EMA 200", e200)
Because only the cells written on the newest bar show, a grid whose number of rows changes from bar to bar needs no clean-up: write the rows that apply and the rest stay blank.
version 1
study("Averages under the close", overlay = true, precision = 2)

names  = ["EMA 9", "EMA 21", "EMA 50"]
values = [ema(close, 9), ema(close, 21), ema(close, 50)]

board = table("Close is above", 3, 1, position = "topLeft")

if bar.isLast
    slot = 0
    for i = 0 to size(names) - 1
        if not isNone(element(values, i)) and close > element(values, i)
            cell(board, slot, 0, element(names, i))
            slot += 1
Remarks. align is "left", "center" or "right"; put labels left and numbers right, so the digits line up. Writing the same cell twice on a bar keeps the last write. clear() empties every cell written so far on this bar, for a script that builds its grid in more than one pass and wants to start again. There is no merged cell: for a header across a row, write the text in the first column and give every cell in the row the same bgColor. str.padLeft() and str.repeat() help line text up inside a cell, or draw a small meter from characters.
See also. table(), clear(), text(), str.format(), Tables
What a table is not for
| You want | Use | Because |
|---|---|---|
| A value on every bar | plot() | A table shows one state, not a history |
| An event on one bar | signal() | A marker stays on the bar where it happened |
| A caption on a shape | draw.label(), or a box's own text | It belongs beside the thing it describes |
| A regime over a stretch of bars | background() | A regime belongs to bars, not to a corner |
Related
Tables, Visuals overview, Plotting, Drawing objects, Strings, bar.*, Debugging.