
Bar colouring and backgrounds
Recolour the instrument's own candles with barColor, shade whole bars with background, and decide when a fact belongs to a bar rather than to a price.
On this page
Two calls paint bars rather than values. barColor() recolours the
instrument's own candles, and background() shades the full height of a
bar's column behind everything else in the pane. Reach for them when the thing
you want to show is a state the bar is in, such as a trend direction, a
volatility regime or the first fifteen minutes of the NSE session, rather than
a number with a price to sit at.
This page covers both calls, how to switch a paint off on the bars that do not matter, which study owns the candles when several want them, and how to decide between shading bars and drawing a zone with a top and a bottom.
A first example
This study colours each candle by which side of a slow exponential moving average (EMA) a fast one is on, and leaves the candles alone until both averages have a value:
version 1
study("Trend regime", overlay = true, precision = 2)

fastLen = input(20, "Fast length", min = 1, max = 500)
slowLen = input(50, "Slow length", min = 1, max = 500)
paint   = input(true, "Recolour the candles")

fast = ema(close, fastLen)
slow = ema(close, slowLen)

// Absent until the slow average has warmed up, not false.
up = fast > slow

// Three states: warming up, up and down.
tint = isNone(up) ? none : (up ? lime : red)

barColor(paint ? tint : none)

plot(fast, "Fast", aqua, width = 2)
plot(slow, "Slow", orange, width = 2)
Three lines in it carry the ideas the rest of this page builds on:
upis absent on the early bars, not false. A comparison with an absent operand is absent, so for the first 49 barsuphas no value. See Absent values.tinthas three states. An absent condition takes the false branch of a ternary, soup ? lime : redwould paint every warmup bar red and claim a downtrend nobody measured. TestingisNone()first and passingnoneleaves those bars their own colour.paintis a switch. It lets a reader keep the two lines and hand the candles back to another study without deleting anything. The section on which study owns the candles explains why that matters.
The two calls
barColor(color) | background(color) | |
|---|---|---|
| Paints | The instrument's own candles | The full height of the bar's column |
| Sits | In front, as the candle itself | Behind the candles, plots, fills and drawings |
Passing none | Leaves the bar its own colour | Leaves the bar unshaded |
| Called twice on one bar | The last call wins | The last call wins |
| Cost | One colour per bar | One colour per bar |
Both calls may appear anywhere a statement may: at the top level, inside an
if, inside a loop or inside a function. They are per-bar paint rather than
part of the study's fixed shape, so the top-level rule that applies to
plot(), fill(), level() and table() does not apply to them.
They are also the cheapest thing a script can put on a chart. Neither creates an object, holds a handle or needs deleting, so a study that paints fifty thousand bars costs one colour per bar and nothing more.
Passing an absent colour is never an error. barColor(none) and
background(none) are how a conditional paint switches itself off on the bars
it has nothing to say about.
Recolouring the candles
barColor does not add anything to the chart. It changes what is already there,
and that makes it a trade rather than a gain: a candle's colour already tells
the reader whether the bar closed above or below its open, and a study that
repaints it replaces that fact with its own.
Two habits follow from that:
- Paint a state the reader cannot see otherwise. Trend direction, a regime, which side of a trailing stop price is on. Not something the candle already shows.
- Paint only the bars that matter. A study that marks eleven interesting
bars out of two hundred should pass
noneon the other hundred and eighty-nine rather than painting every bar in a slightly different shade of the same idea.
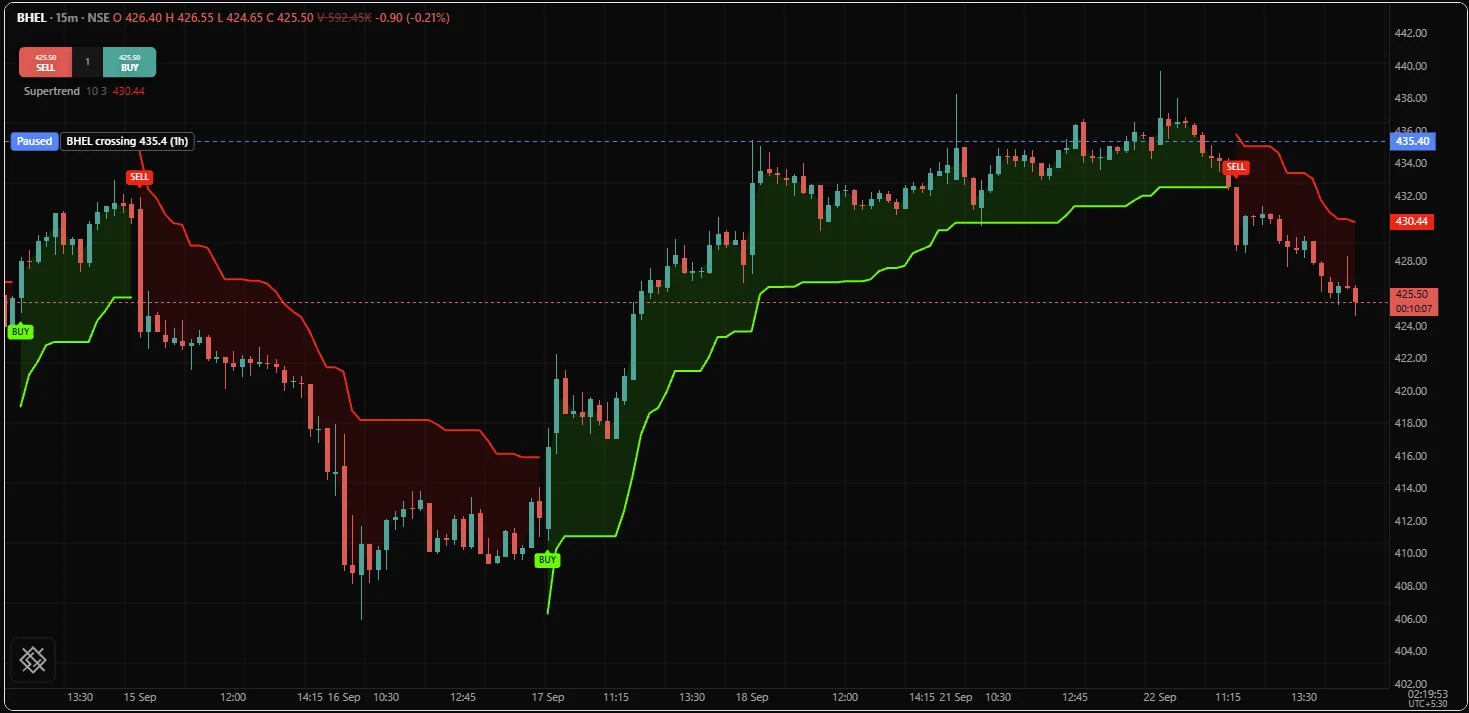
A trailing stop is the classic case, because "which side of the stop is price
on" is exactly the state a trader wants to see at a glance. The built-in
supertrend() computes one: a stop that trails price at a multiple of the
average true range (ATR, the typical size of one bar's move). It returns an
array of two numbers, the stop line in st[0] and the direction in st[1]:
version 1
study("Supertrend candles", overlay = true, precision = 2)

factor = input(3.0, "Band width, in ATR", min = 0.5, max = 20)
atrLen = input(10, "ATR length", min = 1, max = 200)
paint  = input(true, "Recolour the candles")

st       = supertrend(factor, atrLen)
stop     = st[0]
longSide = st[1] < 0    // direction is -1 while long and 1 while short

plot(longSide ? stop : none, "Stop, long", lime, width = 2)
plot(longSide ? none : stop, "Stop, short", red, width = 2)

tint = isNone(longSide) ? none : (longSide ? lime : red)
barColor(paint ? tint : none)
The screenshot shows the same kind of stop drawn by a Supertrend study on an NSE
chart, with the space between the stop and price shaded and a marker where the
trend flips. Its candles keep their own colours: that is the part barColor
changes.
Only one study colours the candles
Inside one script the rule is simple: barColor writes one colour per bar, so a
script that calls it three times on a bar writes the same place three times and
the last call wins. The same holds for background.
Between studies there is a second rule. A candle has one body and one border, so there is no honest way to split it between two studies that both have an opinion: only one study colours the candles at a time. On the /trading chart, when several studies recolour the candles, the one added to the chart most recently owns them, and the bar colouring of every other study is not drawn. The chart recomputes its studies in the order they were added, every time, so the same study wins on every redraw and the candles do not flicker between two meanings.
Three consequences are worth knowing while you write:
- Adding a second colouring study takes the candles, which is usually what the person adding it meant.
- Adding a study that does not call
barColorchanges nothing. - A study in its own pane that calls
barColorstill recolours the price candles, and takes part in the same rule.
Hiding the owning study in the legend withdraws its colours at once. The candles show their own colours until another colouring study next recomputes, on the next update of the chart.
Backgrounds need no such rule. Two translucent shadings compose, so every study that shades a bar is drawn.
What the rule asks of you as an author is two small courtesies:
- Give the user a switch. An input named "Recolour the candles" lets a reader keep your study and hand the candles to another one.
- Say so in the title or the description. A study that quietly takes the candles is hard to debug when two of them are on one chart.
Shading bars with background
background paints the full height of the bar's column, behind the candles,
the plots, the fills and everything else in the pane the study draws in. For an
overlay study that is the price pane. For a study with its own pane it is that
pane.
There is no start and no end to give it. A shaded region is a run of consecutive bars that each paint themselves, and it ends on the first bar that does not. This study shades the first fifteen minutes of every session, the stretch when many intraday traders on NSE and BSE wait for the opening range to settle:
version 1
study("Opening window", overlay = true)

window = input("0915-0930", "Shade this window")
shade  = input(true, "Shade it")

// Read in the chart's own timezone, so 0915 is 09:15 IST on an NSE chart.
inWindow = session.isIn(window)

background(shade and inWindow ? fade(silver, 92) : none)
session.isIn() takes a window written "HHMM-HHMM", with an optional list of
weekdays after a colon: "0915-1530:12345" is 09:15 to 15:30, Monday to
Friday, where 1 is Monday and 7 is Sunday. A bar is inside the window when the
time it opens is, and the end time itself is outside, so on a 5 minute chart
"0915-0930" shades the bars that open at 09:15, 09:20 and 09:25. A window
whose end is before its start crosses midnight. Change the input to
"1500-1530" and the same study shades the last half hour, when intraday
positions are being squared off. The Sessions and time
page covers session windows in full.
A bar or a price: background or a box
This is the question that decides, every time, whether to shade bars or to draw a zone. Ask what the thing you want to show is attached to.
A supply zone is attached to prices. It runs from, say, 24,180 to 24,240 on a NIFTY future, and it means something at those prices and not at others. Price can be inside it, above it or below it, and its top and bottom are the information. That is a box: two times, two prices, a handle and a lifecycle. See Lines and boxes.
A regime is attached to bars. "Volatility is expanded", "the session is in its first fifteen minutes", "the daily trend is up", "this study is still warming up": none of these is truer at 24,180 than at 24,240. They are statements about a moment, and a moment on a chart is a bar. That is a background, which paints the whole height of the bar because the whole height is what the statement covers.
Painting a regime bar by bar, rather than as a region, is what makes it behave:
| Property | Why per-bar paint gets it right |
|---|---|
| The shading is exactly as long as the condition | It is recomputed from the condition on every bar, so it cannot be one bar too wide |
| It needs no anchor | There is no start time to store and no end time to guess |
| It needs no deletion | Nothing persists between bars, so nothing accumulates |
| It cannot drift when older history loads | There is no index and no anchor to move |
| It follows a changed input at once | The condition is recomputed; a drawn region would have to be found and redrawn |
| It costs one colour per bar | Not one object per region |
The reverse holds too: a background cannot say "between these two prices", so a supply zone painted as a background claims the whole chart is supply.
| The fact you want to show | Call | Anchored to |
|---|---|---|
| A value the chart has on every bar | plot() | The bar and the value |
| The space between two values | fill() | Two plots |
| A fixed reference price | level() | A price |
| A price band over a stretch of time | draw.box() | Two times and two prices |
| A direction this bar is in | barColor() | The bar |
| A regime this bar is in | background() | The bar |
| Something that happened on this bar | signal() | The bar |
| The current reading of several things | table() | A corner of the pane |
Using both at once
The two calls carry different kinds of fact, so a study can use both without saying anything twice: direction on the candles, regime behind them.
version 1
study("Volatility regime", overlay = true, precision = 2)

atrLen  = input(14, "ATR length", min = 1, max = 200)
meanLen = input(50, "Compare against", min = 2, max = 500)
hot     = input(1.5, "Expanded above this ratio", min = 1, max = 5)
cold    = input(0.7, "Compressed below this ratio", min = 0.1, max = 1)
paint   = input(true, "Recolour the candles")

// Named once and used twice: each atr() call site keeps its own state.
atrValue = atr(atrLen)
ratio    = atrValue / sma(atrValue, meanLen)

up   = close > ema(close, meanLen)
tint = isNone(up) ? none : (up ? lime : red)

// The candles carry direction. The background carries the regime.
barColor(paint ? tint : none)

background(isNone(ratio) ? none :
           (ratio > hot ? fade(orange, 90) :
           (ratio < cold ? fade(navy, 90) : none)))
ratio compares this bar's ATR with its own average over the last meanLen
bars. At the default settings, above 1.5 the market is moving half as much again
as usual and the bar is shaded orange; below 0.7 it is unusually quiet and the
bar is shaded navy; in between it is left alone.
The nested ternary is the ordinary way to write a three-way choice, and it stays
readable because each arm is one call. When a fourth state arrives, move the
choice into a switch before the paint call rather than adding another level:
atrValue = atr(14)
ratio    = atrValue / sma(atrValue, 50)

tone = none
switch
    case isNone(ratio)
        tone = none
    case ratio > 1.5
        tone = fade(orange, 90)
    case ratio < 0.7
        tone = fade(navy, 90)
    default
        tone = none

background(tone)
tone is declared before the switch because a name first assigned inside an
arm belongs to that arm and does not exist after it. Declaring it first also puts
the default where a reader sees it. See Control flow.
Paint on the forming bar
The newest bar of a chart that is receiving updates runs again on every update,
and paint is recomputed from scratch each time. Neither call waits for the
bar to close the way a signal(), an alert() or an order does.
That difference is deliberate. A signal is a claim that something happened, and a claim that evaporates before the close was never worth making, so signals wait for confirmation. Paint states what the data shows right now, it costs nothing to redraw, and nothing accumulates: the bar's output is thrown away and rebuilt on every update, so the last state is the only state.
If a paint should appear only on a settled bar, say so with
bar.isConfirmed:
tint = close > open ? lime : red
barColor(bar.isConfirmed ? tint : none)
Realtime and confirmation explains the forming bar in full.
Candles a study draws itself
barColor recolours the instrument's candles. A study that produces candles of
its own, such as smoothed candles or a higher timeframe candle, draws them with
plotCandles() and colours them there:
version 1
study("Smoothed candles", overlay = false, precision = 2)

len = input(5, "Smoothing", min = 1, max = 50)

plotCandles(ema(open, len), ema(high, len), ema(low, len), ema(close, len), "Smoothed",
            colorUp = fade(lime, 40), colorDown = fade(red, 40))
The two do not interact. plotCandles is a plotted column with four sources, so
it follows the plot rules: top level only, hidden on a bar by passing absent
values, and coloured through its own arguments. barColor is per-bar paint on
the instrument's candles. Reaching for the wrong one is the usual way a higher
timeframe candle study ends up fighting the chart. Plots
covers plotCandles in full.
Common mistakes
| Symptom | Cause | Fix |
|---|---|---|
| The warmup bars are painted as a downtrend | An absent condition took the false branch | isNone(cond) ? none : (cond ? up : down) |
| The shaded stretch hides the candles | Transparency too low | fade(c, 90) or higher for a background |
| Your candle colours do not show with two studies loaded | A study added to the chart after yours also recolours the candles | Turn one off at its switch; only one study owns the candles |
| Nobody can keep the study without its candle colours | No switch declared | Add an input and pass none when it is off |
| A zone drawn as a background covers the whole pane | A price band painted as a regime | Use draw.box(), which has a top and a bottom |
| The colour changes while the bar is forming | The condition really does change during the bar | Guard with bar.isConfirmed if only settled bars should paint |
| Nothing is painted at all | fade(c, 100), which is fully transparent | fade takes transparency; use 85 to 95 for a background |
Related. Colors for building the colours these
calls take, Lines and boxes for a zone with a
top and a bottom, Labels and shapes for
marking one bar rather than a stretch, Tables for
stating the regime in words, and the reference entries barColor() and
background().