
Inputs
input() turns a value in a script into a row of its settings dialog. Every kind it supports (number, switch, text, menu, colour, source, timeframe and time), the arguments each takes, and how a saved setting is checked.
On this page
An input is a value the person using a study can change without opening the script: a length, a multiplier, which price to read, which average to use, a colour, a higher timeframe, an anchor date. Every call to input() does three things at once. It gives the script a value to read, it builds one row of the study's settings dialog, and it names the slot the reader's choice is saved under, so the choice comes back when the chart is opened again.
There is one function, and the kind of row it builds follows the type of the default you give it. A kind argument picks the two kinds a type alone cannot, and an options list turns a text row into a menu.
version 1
study("Configurable average", overlay = true)

src    = input(close, "Source")
len    = input(20, "Length", min = 2, max = 500)
maType = input("ema", "Average type",
               options = ["sma", "ema", "wma", "rma", "hma", "vwma"])

bySlope   = input(true, "Colour by slope")
upColor   = input(lime, "Rising")
downColor = input(red, "Falling")

m = ma(src, len, maType)

plot(m, "Average", bySlope and m < m[1] ? downColor : upColor, width = 2)
Six settings, and a study that works on any instrument and any interval without anyone editing it. Nothing in the script branches on maType: ma() takes the type name directly, which is why the menu's options are the type names.
The settings dialog in /trading
On the /trading page you open a study's settings from its row in the chart legend. The dialog has two tabs:
- Inputs holds one row per
input()call, in the order the script declares them. - Style holds rows the chart adds for every plot without the script declaring anything: its colour, opacity, thickness, line style and plot style.
Defaults at the bottom puts every row back to the script's defaults, and Ok applies the changes.
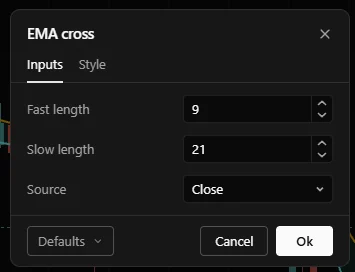
The kinds at a glance
| Kind | Written as | Row in the settings dialog | The script gets |
|---|---|---|---|
| Number | input(14, "Length") | A number field with up and down arrows | number |
| Switch | input(true, "Show the band") | A tick box | bool |
| Text | input("", "Note") | A text field | string |
| Menu | input("ema", "Type", options = [...]) | A drop-down of the listed values | string |
| Colour | input(aqua, "Band colour") | A colour swatch | color |
| Source | input(close, "Source") | A drop-down of the price series | a series, one value per bar |
| Timeframe | input("1D", "Bias timeframe", kind = "interval") | A drop-down of intervals | string |
| Time | input("2025-01-01", "Anchor", kind = "time") | A text field for a date and time | number, a timestamp |
| Symbol, planned | kind = "symbol" | An instrument picker | string |
| Price, planned | kind = "price" | A price set by clicking the chart | number |
| Session, planned | kind = "session" | Two clock fields | string |
The function
input()
Declares one setting and returns its value. The first argument is the default, and its type decides the kind of row; the second is the row's label. The value is known before the first bar and is the same on every bar, so you can use it anywhere a plain value of its type fits.
input(
    value: any,
    title?: string,
    min?: number,
    max?: number,
    step?: number,
    options?: array<string>,
    kind?: string,
    group?: string = "",
    tooltip?: string = "",
    inline?: string,
    confirm?: bool
) -> any| Parameter | Type | Default | Notes |
|---|---|---|---|
value | any | required | |
title | string | optional | Fixed before the first bar |
min | number | optional | Fixed before the first bar |
max | number | optional | Fixed before the first bar |
step | number | optional | Fixed before the first bar |
options | array<string> | optional | Fixed before the first bar |
kind | string | optional | One of "interval", "time", "symbol", "price", "session". Fixed before the first bar |
group | string | "" | Fixed before the first bar |
tooltip | string | "" | Fixed before the first bar |
inline | string | optional | Fixed before the first bar |
confirm | bool | optional | Fixed before the first bar |
- Returns
any- First value
- bar 0
len  = input(20, "Length", min = 2, max = 500)
mult = input(2.0, "Band width, in standard deviations", min = 0.5, max = 5, step = 0.1)

basis = sma(close, len)
dev   = mult * stdev(close, len)

plot(basis, "Basis", orange)
plot(basis + dev, "Upper", aqua)
plot(basis - dev, "Lower", aqua)
Remarks. The settings dialog is built once, before the first bar, from the input() calls the compiler can see. Every rule about input() follows from that:
- It is written at the top level of the file, outside any block: as an assignment, inside a larger expression, as a declaration option such as
study("B", precision = input(2, "Decimals")), or inside the expression of areq.timeframe()read. Inside anif, a loop or a function it is OS3007. - The default is fixed before any data arrives: a literal, arithmetic over literals, a colour built from literals such as
fade(aqua, 50), or, for a source, one of the price series. A default computed from bar data is OS3003. - The title is written as a string literal on the line. When the input is assigned to a name, the title can be left out and defaults to that name.
- An input has no warmup: its value exists on bar 0.
See also. ma(), req.timeframe(), table(), Declarations
Kinds of input
Number
A number default builds a number field with up and down arrows. It is the input for a length, a multiplier, a threshold or a quantity. min and max bound the value, and step sets how far one click of an arrow moves it.
atrLen   = input(14, "ATR length", min = 1, max = 200, step = 1)
stopMult = input(2.0, "Stop, in ATR", min = 0.5, max = 10, step = 0.1)

plot(close - stopMult * atr(atrLen), "Long stop", red, style = "step")
Set min on every length. The arrows stop at min and max, but a reader can still type a number past them, and the dialog saves it as typed. The study then refuses to load, with OS6019 naming the setting and the bound, before it can draw a wrong line. Without the bound, a length of 0 reaches the indicator and stops the study at run time with OS4003 instead.
step shapes the arrows only. A reader who types 2.35 into a field with step = 0.1 keeps 2.35.
Switch
A true or false default builds a tick box. Use it for the optional part of a study, such as a band, a fill or recoloured candles.
showBands = input(true, "Show the bands")

b = bollinger(close, 20, 2)
plot(showBands ? b[1] : none, "Upper", aqua)
plot(showBands ? b[2] : none, "Lower", aqua)
A switch gates what is drawn, not what is computed. plot() cannot sit inside an if (OS3006), so a switch hides a plot by passing none, which draws nothing on that bar. Keep indicator calls such as bollinger at the top level, outside any branch, so they see every bar; the compiler warns when one sits in a branch.
Text
A string default with no options and no kind builds a text field: for a label, a note, or a value the script reads itself, such as a list of price levels.
note  = input("Watch the 22,500 level", "Note")
panel = table("Note", 1, 1, position = "bottomLeft")

if bar.isLast
    cell(panel, 0, 0, str.trim(note))
Text is read exactly as it is typed, so trim it with str.trim() and turn numbers in it into numbers with toNumber(). When the value must be one of a few fixed words, use a menu instead: the reader cannot mistype it.
Menu
Add options, a list of strings, and the same string default builds a drop-down over exactly those values. The default must be one of them.
corner = input("topRight", "Panel corner",
               options = ["topLeft", "topRight", "bottomLeft", "bottomRight"])

panel = table("Last close", 1, 2, position = corner)

if bar.isLast
    cell(panel, 0, 0, chart.symbol)
    cell(panel, 0, 1, text(close, 2), align = "right")
A default outside the list is caught when the script compiles, because the drop-down would open with nothing selected:
maType = input("ema", "Average type", options = ["sma", "wma"])The options must be strings: a list of numbers is OS3011. A saved value that is not in the list, for example after you remove an option from the script, stops the study from loading with OS6019. Menus pair naturally with arguments that accept a fixed set of names, such as the type of ma() and the position of table().
Colour
A colour default builds a colour swatch. The Style tab already gives every plot its own colour row, so declare a colour input when one choice should drive several things at once, or when the script computes with the colour.
tint = input(aqua, "Band colour")

b = bollinger(close, 20, 2)
upper = plot(b[1], "Upper", tint)
lower = plot(b[2], "Lower", tint)
fill(upper, lower, fade(tint, 90))
Pass the input straight to a plot, as above, and that plot's colour row on the Style tab and your row on the Inputs tab become one setting: change either and both follow. The default may be a named colour, a hex literal or a colour built from literals.
The swatch picks red, green and blue only; it has no opacity control. A colour chosen there keeps the opacity of the default, so input(fade(aqua, 50), "Band colour") stays half transparent whatever colour the reader picks. Apply any other transparency in the script, as fade(tint, 90) does for the fill. See Colors.
Source
A price series as the default builds a drop-down of the series the study can read. In /trading it lists the seven price series: open, high, low, close, hl2, hlc3 and ohlc4. The script gets a series, one value per bar, and uses it exactly like close.
src = input(hlc3, "Source")
plot(ema(src, 20), "EMA 20", aqua)
Use one of those seven as the default. volume is accepted as a source too, but the /trading drop-down does not list it. Other bar values, such as oi, hlcc4 or time, compile as a default, but the study then refuses to load with OS6019.
Timeframe
kind = "interval" with a string default builds a drop-down of intervals. The script gets a timeframe string, ready for req.timeframe().
version 1
study("Higher timeframe bias", overlay = true)

biasTf  = input("1D", "Bias timeframe", kind = "interval")
biasLen = input(20, "Bias length", min = 2, max = 200)

bias = req.timeframe(biasTf, ema(close, biasLen))

plot(bias, "Higher timeframe EMA", orange, width = 2, style = "step")
barColor(isNone(bias) ? none : close > bias ? fade(lime, 40) : fade(red, 40))
A timeframe is a count and a unit: "5m", "1h", "1D", "1W", "1M". The units are case sensitive, so "1M" is a month and "1m" a minute, and a bare number counts minutes, so "60" and "1h" are the same. A timeframe finer than the chart's own stops the study from loading with OS6002, because bars that were never loaded cannot be invented. Higher timeframes covers the read itself.
In /trading the drop-down lists Chart interval first, then the intervals your broker serves (for example 1m, 5m, 15m, 1h and D), and it keeps the study's current value in the list even when the broker does not name it.
Time
kind = "time" with a date string builds a text field for a date and time; in /trading the empty field shows the pattern YYYY-MM-DD HH:MM. Write the default as "YYYY-MM-DD HH:MM", or as "YYYY-MM-DD" for midnight at the start of that day. The script gets a timestamp, the same kind of number as time (milliseconds since 1 January 1970, UTC), so the two compare directly.
version 1
study("Anchored VWAP from a date", overlay = true)

anchorTime = input("2025-01-01", "Anchor date", kind = "time")

// True on the first bar at or after the anchor, and on no other bar.
isAnchor = time >= anchorTime and orElse(time[1], 0) < anchorTime

anchored = vwapAnchor(hlc3, isAnchor)
plot(time >= anchorTime ? anchored : none, "Anchored VWAP", orange, width = 2)
This is the one kind whose saved value and returned value differ. The saved value is the text, a clock reading, so a layout saved in one timezone opens at the same clock time in another. The returned value is the timestamp a script needs for comparing with time. Text that is not a date stops the study from loading with OS6019.
Which timezone the text is read in is up to the host. The language intends the chart's own timezone, but the /trading page in this release reads it as UTC: "2025-01-01 09:15" there means 09:15 UTC, which is 14:45 in India. That is why the example gives a date alone. Midnight UTC is 05:30 in India, before the 09:15 open, so the anchor lands on the first bar of that day either way.
Planned kinds
Three more kinds are named in the language and not available in this release. Writing one is OS2001, which says the kind is not defined:
window = input("0915-1530", "Trading window", kind = "session")| Kind | Will build | Until then |
|---|---|---|
kind = "symbol" | An instrument picker | A text input holding the symbol, passed to req.symbol() |
kind = "price" | A price the reader sets by clicking the chart | A number input |
kind = "session" | Two clock fields | A text input holding a window such as "0915-1530", passed to session.isIn() |
window = input("0915-1530", "Trading window")
background(session.isIn(window) ? none : fade(gray, 90))
Arguments
| Argument | Kinds | Default | Means |
|---|---|---|---|
| first, the default | every kind | required | The starting value; its type decides the kind |
title | every kind | the name assigned | The row's label, and the second positional argument |
min, max | number | none | The range a saved value must fall in |
step | number | none | How far one click of an arrow moves |
options | text | none | The list of values, all strings; supplying it makes a menu |
kind | text | none | "interval" or "time"; "symbol", "price" and "session" are planned |
group | every kind | "" | A heading to group rows under |
tooltip | every kind | "" | Help text for the row |
inline | every kind | none | Planned: rows sharing a value sit on one line |
confirm | every kind | none | Planned: ask for the value when the study is added |
inline and confirm are accepted by the compiler in this release and have no effect yet.
title, group, tooltip, options and kind are written on the line itself, as literals (joining two literals with + is fine). The same text held in a name first is OS3003, because the dialog is built before any line of the script runs.
group and tooltip travel with the input for any host that shows them. The /trading dialog in this release lists the rows in the order the script declares them and does not yet show group headings or tooltips, so order your input() calls the way a reader should meet them, and put a unit in the title when it matters, as in "Stop, in ATR":
stopLen = input(14, "ATR length", group = "Risk", min = 1, max = 200,
                tooltip = "Bars of average true range the stop is measured in. "
                        + "A longer length moves the stop less often.")
stopMult = input(2.0, "Stop, in ATR", group = "Risk", min = 0.5, max = 10)

plot(close - stopMult * atr(stopLen), "Stop", red, style = "step")
How a setting is saved and checked
A saved value is filed under the name the input is assigned to, or under its title when it is assigned to no name, as in study("B", precision = input(2, "Decimals")). So you can reorder, add and delete inputs without losing anyone's settings, and you can change the title of an assigned input freely. Renaming the variable, or the title of an input assigned to no name, is the edit that drops the saved value. Because the name or title is a key, the compiler holds every input to a few rules:
| Mistake | Code |
|---|---|
| Two inputs with the same title | OS3017 |
| An unnamed input whose title spells another input's name | OS3022 |
| An unnamed input with no title | OS3021 |
An unnamed input whose title is "" | OS3024 |
A menu default not in options | OS3018 |
| An input that nothing reads | OS8018, a warning |
fast = input(9, "Length")
slow = input(21, "Length")
plot(ema(close, fast) - ema(close, slow), "Gap")
When the study loads, each saved value is checked against its input: the type, min and max, the menu's options, the source list and a readable date. A value that fails stops the study with OS6019, naming the setting and the rule. The study does not quietly fall back to the default, because a chart drawing numbers from settings the reader did not choose, with nothing on screen to say so, is worse than a clear message. Fix the value in the dialog, or press Defaults.
var in front of an input
len = input(14, "Length") makes len another name for the setting. var tally = input(0, "Start") is different: it is an ordinary var (a variable that keeps its value from one bar to the next) whose starting value is the setting, and later lines may change it.
var tally = input(0, "Start counting from")
tally += 1
plot(tally, "Bars counted")
Because a var can change from bar to bar, it no longer counts as a fixed setting. Reading it inside a higher timeframe read is OS6003, where the plain form works. Write the plain form when you want the setting itself.
Related
Inputs guide, Settings and style, Declarations, Colors, Higher timeframes, Strings.