
Debugging
Find the exact bar where a value first goes wrong and the exact line that does it, using plots, painted bars, a debug table, labels and the diagnostics console, and what print and the log can and cannot do.
On this page
This page shows how to take an OpenScript study or strategy (OpenScript is also called OpenAlgo Script) that produces a wrong number, or no number at all, and find the first bar where it goes wrong and the line that causes it. You need it the first time a line on your chart has a hole in it, a signal fires where it should not, or a strategy's backtest does something you cannot explain.
Why there is no stepper
A script is the body of a loop that runs once per bar, top to bottom, oldest bar first, over a chart that may hold tens of thousands of bars. By the time you look at the chart the loop has already finished. There is no breakpoint to set and no variable inspector to open, because there is nothing left running to attach one to. See the execution model.
So debugging in OpenScript is not stepping. It is making the script show what it did, on every bar or on one chosen bar, and reading that back. There are five ways to make it show you.
| Way | Shows | Best for |
|---|---|---|
A plot() | One number per bar, drawn | Finding the bar a value goes wrong on |
background() or barColor() | One fact per bar, painted behind or on the candles | Finding which bars are absent, or which bars a branch ran on |
A table() | A grid of values written on the newest bar | Watching many values at once |
draw.label() | Text pinned to one bar at one price | Freezing the state of a chosen bar where you can see it |
print() | A line in the script's log, with the bar's time | A trace over many bars, in a host that shows a log |
Here is the most useful single debugging line in the language. It shades every bar where a value is absent (has no value, see Absent values), and it usually shows the cause at a glance: a block of shading at the left edge is warmup, a stripe in the middle is a gap in the data or a branch that did not run.
value = rsi(close, 14)

// Shade every bar where the value is absent.
background(isNone(value) ? fade(red, 85) : none)
plot(value, "RSI")
Start with three questions
Three questions, asked in this order, solve most problems.
- Is the value absent, or is it wrong? These are different bugs with different causes. Absence usually comes from warmup, a gap in the data, or a branch that did not run. A wrong number usually comes from arithmetic, an off-by-one lookback, or state updated in the wrong order.
- On which bar does it first go wrong? Not "it looks wrong on the right of the chart". The first bar. Everything after the first wrong bar is a consequence.
- What did the inputs to that line hold on that bar? Once you have the bar, put everything that feeds the line on the chart for that bar, and check it against arithmetic you do by hand.
Make a value visible
Plot it
The fastest look at any intermediate value is a plot. Two things get in the way, and each has a one line fix.
A bool cannot be plotted. There is no conversion from bool to number, so write it out. That is also a chance to tell "false" apart from "absent", which is the distinction that matters.
r = rsi(close, 14)
hot = r > 70

// Three states: 1 for true, 0 for false and a gap for absent. Plotting
// orElse(hot, false) instead would draw a confident zero through the warmup.
plot(isNone(hot) ? none : (hot ? 1 : 0), "debug: hot", fuchsia, style = "step")
A debug plot on a price overlay flattens the price scale. A value of 50 on a pane where NIFTY trades near 25,000 squashes everything. Put the debug plot on the other scale, or debug in a separate copy of the study with overlay = false.
version 1

study("Bands, with a debug line", overlay = true, precision = 2)

basis = sma(close, 20)
dev = 2 * stdev(close, 20)

plot(basis, "Basis", orange)
// On the left scale, so a value near 50 does not flatten a price near 25000.
plot(dev, "debug: deviation", fuchsia, scale = "left")
Delete debug plots before you share a script. Each one takes a legend row and a row in the settings dialog, and a plot the compiler can see is absent on every bar earns warning OS8009.
Paint the bars
background() and barColor() answer "which bars" faster than any plot, because you read them without looking at a scale. The absent-value line at the top of this page is one use. The same trick shows which bars a branch ran on. Here it marks the bars of the NSE opening range, 09:15 to 09:30:
var rangeHigh = none
forming = session.isIn("0915-0930")
// The range's first bar: inside the window, and the bar before was not.
starts = forming and not orElse(forming[1], false)

// Declared before the if, so the background call below can read it.
taken = false
if forming
    rangeHigh = starts ? high : max(orElse(rangeHigh, high), high)
    taken = true

background(taken ? fade(aqua, 90) : none)
plot(rangeHigh, "Opening range high", aqua, style = "step")
taken is declared before the if on purpose. A name first assigned inside a block belongs to that block, so assigning it only inside would put it out of reach of the background call (OS2001). See Variables and scope.
Write a debug panel
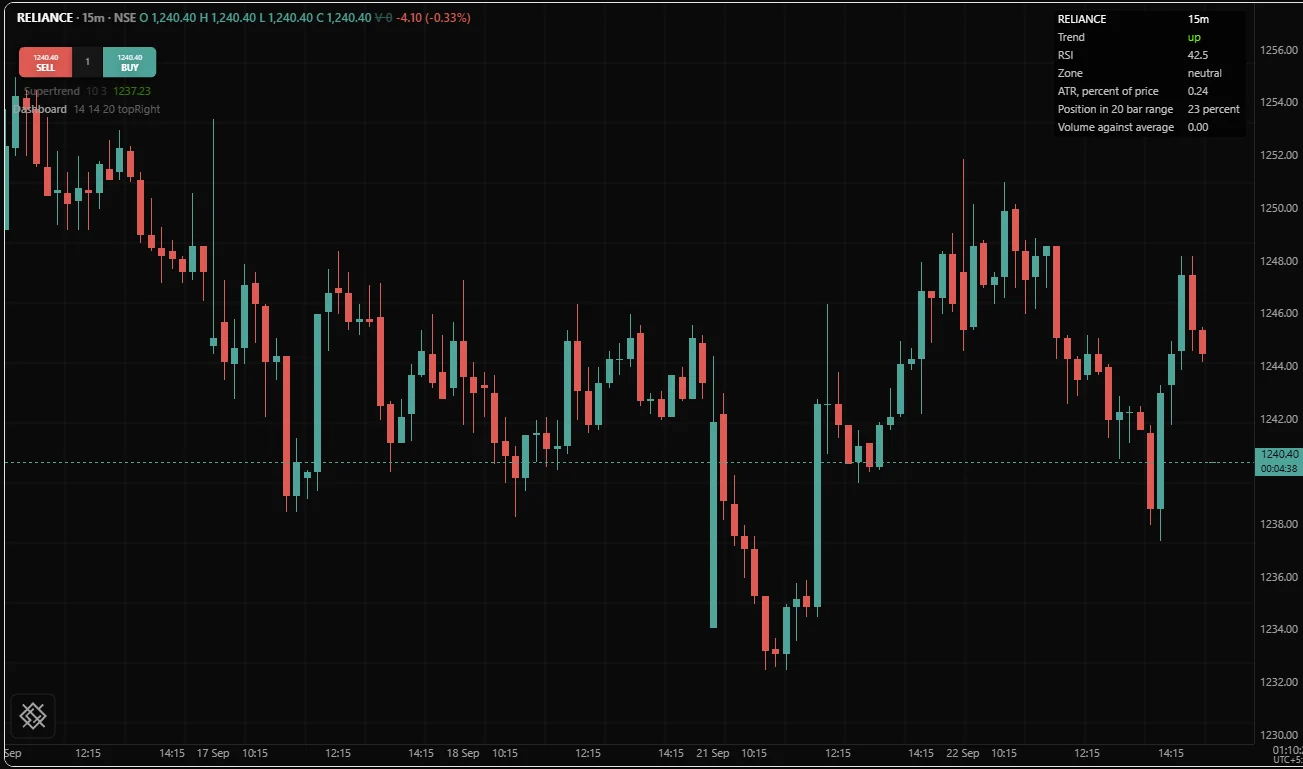
A table is the closest thing to a variable inspector. Declare it at the top level, because the pane reserves room for it before bar 0. Write the cells on the newest bar (bar.isLast): the chart shows the cells the newest bar wrote, so cells written only on an older bar never appear, and writing them on every bar is wasted work.
version 1

study("Bands, with a debug panel", overlay = true, precision = 2)

length = input(20, "Length", min = 2, max = 500)
widthDev = input(2.0, "Band width", min = 0.1, max = 10)
showPanel = input(true, "Show the debug panel")

basis = sma(close, length)
dev = widthDev * stdev(close, length)
upper = basis + dev

// Declared at the top level. A table inside an if is OS3006, for the same
// reason a plot is: the grid is part of the study's fixed shape.
panel = table("Debug", 6, 2, position = "topRight",
        textColor = silver, bgColor = fade(black, 25))

// One place that decides what an absent value looks like. A blank cell hides
// that the study is warming up, and a zero invents a number.
fn show(value, decimals) => isNone(value) ? "absent" : text(value, decimals)

if showPanel and bar.isLast
    cell(panel, 0, 0, "bar.index")
    cell(panel, 0, 1, text(bar.index, 0))
    cell(panel, 1, 0, "bar.updates")
    cell(panel, 1, 1, text(bar.updates, 0))
    cell(panel, 2, 0, "confirmed")
    cell(panel, 2, 1, bar.isConfirmed ? "yes" : "no")
    cell(panel, 3, 0, "basis")
    cell(panel, 3, 1, show(basis, 4))
    cell(panel, 4, 0, "dev")
    cell(panel, 4, 1, show(dev, 4))
    cell(panel, 5, 0, "upper")
    cell(panel, 5, 1, show(upper, 4))

plot(basis, "Basis", orange, width = 2)
bar.updates (how many times the newest bar has run) and bar.isConfirmed (whether the bar has closed) are in that panel on purpose. During market hours the newest bar is still forming and runs again on every update, and those two facts explain most reports of "it worked in the backtest". See Realtime and confirmation.
Step through a script
Stepping through a per-bar script means one of three things, and they are worth keeping apart. All three use labels, because a label stays on the bar it was drawn on and you can read it on the chart.
Stepping through the bars. Pick a short window of bars, shade it, and label each bar in it with the values you care about. Widen or move the window until you see the bar where a value changes in a way you did not expect. This is the real equivalent of a stepper.
fromBar = input(240, "Trace from bar", min = 0)
toBar = input(245, "Trace to bar", min = 0)

basis = sma(close, 20)
dev = 2 * stdev(close, 20)

fn show(value, decimals) => isNone(value) ? "absent" : text(value, decimals)

inWindow = bar.index >= fromBar and bar.index <= toBar
if inWindow
    draw.label(time, high,
            text(bar.index, 0) + ": basis " + show(basis, 2) + ", dev " + show(dev, 2),
            color = fade(black, 20))

background(inWindow ? fade(aqua, 90) : none)
plot(basis, "Basis")
Stepping through the lines of one bar. Put the intermediate values on one chosen bar, numbered in source order. Execution is strictly top to bottom with no callbacks, so a numbered list of intermediates in source order is a complete record of that bar.
watchBar = input(-1, "Label this bar index, -1 for none")

basis = sma(close, 20)
dev = 2 * stdev(close, 20)
upper = basis + dev

fn show(value, decimals) => isNone(value) ? "absent" : text(value, decimals)

if bar.index == watchBar
    draw.label(time, high,
            "1 close " + show(close, 2) + " | 2 basis " + show(basis, 4) +
            " | 3 dev " + show(dev, 4) + " | 4 upper " + show(upper, 4) +
            " | 5 previous upper " + show(upper[1], 4),
            color = fade(black, 20))

plot(upper, "Upper")
Watching the state carried between bars. Show a var before and after the block that updates it. Reading a var before it is reassigned gives the value the previous bar left, which is exactly what you want to see. See Persistence.
fromBar = input(240, "Trace from bar", min = 0)
toBar = input(245, "Trace to bar", min = 0)

long = close > ema(close, 50)
lo = lowest(low, 10)

var stop = none
before = stop  // what the previous bar left
if long
    stop = max(orElse(stop, lo), lo)

fn show(value) => isNone(value) ? "absent" : text(value, 2)

if bar.index >= fromBar and bar.index <= toBar
    draw.label(time, low, "stop in " + show(before) + ", out " + show(stop),
            color = fade(black, 20))

plot(stop, "Trailing stop", red, style = "step")
A label is anchored to a time and a price, so it stays on its bar when more history loads and every bar index shifts. It also lasts until the script deletes it, so a condition that is true on a thousand bars leaves a thousand labels. Keep the window small, or call draw.deleteAll() at the top of the bar while you experiment. draw.count() tells you how many objects the script holds. See Lines and boxes.
Break on a condition
There is no breakpoint, so a break becomes a guard around a dump. State the condition as a bool at the top level, then hang the output off it.
jumpPct = input(0.5, "Report a one bar move larger than this, in percent", min = 0)

basis = sma(close, 20)

// As a percentage, so one setting works on a stock near 500 and on NIFTY near 25000.
moved = not isNone(basis) and not isNone(basis[1]) and abs(basis - basis[1]) / basis[1] * 100 > jumpPct

if moved
    draw.label(time, high,
            "jump from " + text(basis[1], 2) + " to " + text(basis, 2) +
            ", close " + text(close, 2),
            color = fade(red, 20))

background(moved ? fade(red, 70) : none)
plot(basis, "Basis")
Note both isNone() tests. Without them the comparison is absent during warmup, an absent condition takes the false branch, and the break never fires on the bars most likely to hold the problem.
Find the first bar that goes wrong
This is the method the rest of the page serves.
The first-offender pattern
Keep one persistent value. Record the first bar where your value disagrees with one you trust, and mark it once. Everything after that bar is downstream.
version 1

study("Where does it first disagree", precision = 6)

tolerance = input(0.000001, "Tolerance", min = 0)

mine = myCalculation(close, 20)
reference = sma(close, 20)

// Both must be present before a comparison means anything. With one absent the
// comparison is absent, the branch is skipped, and the first real disagreement
// after warmup would be missed or misreported.
comparable = not isNone(mine) and not isNone(reference)
disagrees = comparable and abs(mine - reference) > tolerance

// A time rather than a bar index: loading more history renumbers every bar,
// and a bar's time never moves.
var firstBadTime = none

if disagrees and isNone(firstBadTime)
    firstBadTime = time
    // Drawn once, on the first disagreement only.
    draw.label(time, high,
            "first disagreement, bar " + text(bar.index, 0) +
            ": mine " + text(mine, 8) + ", reference " + text(reference, 8),
            color = fade(red, 20))

panel = table("First offender", 1, 2, position = "topRight", textColor = silver)
if bar.isLast
    cell(panel, 0, 0, "first disagreement")
    cell(panel, 0, 1, isNone(firstBadTime) ? "none" : date.format(firstBadTime, "yyyy-MM-dd HH:mm"))

plot(mine, "Mine", aqua)
plot(reference, "Reference", orange)
plot(comparable ? mine - reference : none, "Difference", fuchsia, scale = "left")

fn myCalculation(src, len) =>
    total = 0.0
    for i = 0 to len - 1
        total += src[i]
    total / len
The table tells you whether there is a disagreement at all and when, and the label sits on the bar itself. The bar index goes into the label, because within one run it is the number you type into a watchBar input, but it is not kept, for the reason in the comment.
Bisect the script
When the first-offender pattern tells you the bar but not the line, halve the script instead of staring at it.
- Take the wrong output and the bar where it first goes wrong.
- Plot or label the value halfway up the chain of lines that feed it, on that bar.
- If the halfway value is right, the bug is below it. If it is wrong, the bug is above it. Repeat.
Four rounds cover a chain of sixteen lines, which is longer than most scripts have. It beats reading, because reading finds the bugs you can imagine and bisection finds the one that is actually there.
Bisect the inputs
If the value is wrong for one setting and right for another, the shortest path is often the input rather than the code. Set the length to 2, or to 1 if the function allows it, and work the arithmetic out by hand. Most off-by-one bugs in a lookback are visible at length 2 and invisible at length 20.
Six bugs that look like other bugs
| Symptom | Usual cause | Confirm it by |
|---|---|---|
| The line never draws | The plotted value is absent on every bar (OS8009 when the compiler can see it), or a name never received what it was meant to hold | background(isNone(value) ? fade(red, 85) : none) |
| The line has a hole in the middle | One absent bar spread through the arithmetic, or a stateful call sits inside a branch that did not run (OS8001) | Label the inputs on the first bar of the hole |
| The line is flat near the left edge, then correct | Warmup hidden by an orElse(x, 0) that draws a confident zero | Remove the orElse and look for the gap |
| A counter stays absent for ever | A plain x = 0 followed by x = x[1] + 1: x[1] is absent on bar 0 and absence spreads to every bar after | Replace it with var x = 0 and x = x + 1 |
| Right in the backtest, different during the session | The forming bar: a live var, onUnconfirmed = true, or a higher timeframe read in "developing" or "lookahead" mode | Put bar.updates and bar.isConfirmed in a debug panel, and search the file for mode = |
| The numbers change when more history loads | A stored bar.index, or a value that depends on where the chart's history starts, such as cum() or a var counter started on bar 0 | Search the file for bar.index in a var, and anchor running values to a session or a date |
The Troubleshooting page lists many more symptoms with their fixes, and Repainting covers values that change after the fact.
Read the diagnostics
Every problem the compiler finds carries a stable code, a line, a column, a message and a fix. In the Scripts panel on the /trading page, every save (Ctrl+S) compiles the script, and the console under the editor lists each diagnostic: its code, its line and column, the line of source with the spot underlined, the message and the fix. The console button in the status bar at the bottom of the panel opens it and shows how many there are. When you get a code, look it up in the error reference: each entry explains the cause and shows a before and after pair that is often your exact situation in four lines.
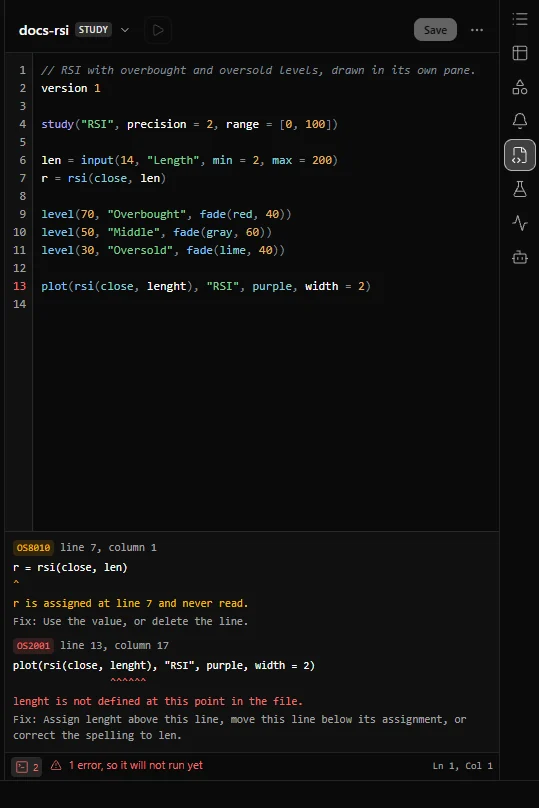
Warnings deserve the same attention. OS8001, OS8010, OS8012 and OS8015 each describe a shape that is nearly always a bug, and clearing one is cheaper than the afternoon of debugging it would otherwise cost.
A problem found while the script runs, such as a loop that runs out of budget or an array read past its end, is not in the console, because the console reports what the compiler found when you saved. The study stops on that bar instead. On the /trading page, the Objects panel marks a stopped study with Error, and if it stops as you add it to the chart, a notification shows the code, the message and the fix. See Limits for the codes you meet this way.
Print and the log
print() writes one line to the script's log, with the bar's time attached. The language defines it so that a host can show a trace over many bars. The /trading page does not show the log in this release, so on that page use the labels and tables above. When you run a script where the log is shown, three rules apply.
Build the string with text(). + joins two strings and does nothing else, so adding a number to a string is OS2003:
r = rsi(close, 14)
print("rsi " + r)
Convert the number first. There are two forms, and the difference matters during warmup. text(x) with no decimals accepts any value and writes an absent one as the word none. text(x, decimals) is for a number you know is present: given an absent value it returns an absent string, and a string joined to an absent value is absent, so the whole line would be lost.
r = rsi(close, 14)

// text(x) with no decimals accepts any value and writes an absent one as
// the word none, so the line is never lost to absence.
print("bar " + text(bar.index, 0) + " rsi " + text(r) + " close " + text(close, 2))
Guard it. An unguarded print writes one line per bar. A host limits how fast the log may fill and says how many lines it dropped, but a trace you have to scroll through is barely better than none. Print a window of bars:
fromBar = input(240, "Trace from bar", min = 0)
toBar = input(260, "Trace to bar", min = 0)

basis = sma(close, 20)
dev = 2 * stdev(close, 20)

if bar.index >= fromBar and bar.index <= toBar
    print("bar " + text(bar.index, 0) +
            " time " + date.format(time, "yyyy-MM-dd HH:mm") +
            " close " + text(close, 2) +
            " basis " + text(basis) +
            " dev " + text(dev))

plot(basis, "Basis")
Know when the line is written. Like signal(), alert() and orders, print waits for the bar to be confirmed. On a forming bar the script runs again on every update, and only the bar's final run writes its line, so you get one line per bar, not one per update. A script that sets onUnconfirmed = true in its declaration opts out of that wait, and then every run of the forming bar writes a line. Add and bar.isConfirmed to the guard if you want one line per bar in that case.
The debugging loop
- Hold the data still. Debug on bars that do not change under you: outside market hours, or in a backtest over a fixed date range in the Backtest panel. A moving dataset turns a reproducible bug into a mystery.
- Reproduce it once. Know the symptom precisely: which plot, which bar, what value you expected.
- Find the first wrong bar with the first-offender pattern.
- Show the state of that bar with a label or a debug panel.
- Form one hypothesis and change one thing.
- Run it again and compare. If the change did nothing, put it back before trying the next one. Two guesses at once is how one small bug becomes two.
- Write the check that would have caught it, while you still remember what it was. See Testing scripts.
Related. Testing scripts, Troubleshooting, Profiling and speed, Limits, Style guide, Warmup, Absent values