
Other instruments
Reading another symbol with req.symbol, such as a stock against NIFTY, a future against its index or two option legs at once, which bar each mode gives you, and what a missing bar means.
On this page
- The call
- Which bar a read gives you
- The symbol is fixed before the first bar
- Waiting for the answer
- Alignment by timestamp
- What a missing bar means
- The cost of a read
- Chart facts describe the chart's instrument
- Index against its future
- A worked example: two legs, one number
- Other instruments in /trading
- Mistakes worth naming
A study often needs a second instrument: a stock measured against the NIFTY index, a future against its index, or two option legs added into one premium. req.symbol() computes an expression on another instrument's bars and places the answer on the bars of your chart. This page covers the call in OpenScript (also called OpenAlgo Script), which of the other instrument's bars each mode hands you, how to tell whether the answer has arrived, what a missing bar means, and what each read costs.
Here is the idea in one study: a stock's close divided by the NIFTY index, which rises when the stock outperforms the index.
version 1

study("Relative strength against NIFTY", precision = 4)

benchName     = input("NIFTY",     "Benchmark symbol")
benchExchange = input("NSE_INDEX", "Benchmark exchange")
smoothLen     = input(20, "Smoothing, in bars", min = 1, max = 200)

// The benchmark's close at the chart's own interval. "developing" hands back
// the benchmark's bar at the same time as this chart bar; the default,
// "confirmed", would hand back the one before it (see "Which bar a read gives
// you" below). Absent until the host has answered, and on any bar the
// benchmark has no bar for.
bench = req.symbol(benchName, chart.interval, close, exchange = benchExchange, mode = "developing")

// Absence carries through the division, so a missing benchmark bar is a gap in
// the line rather than a ratio against zero.
ratio = close / bench

plot(ratio, "Stock over benchmark", aqua, width = 2)
plot(sma(ratio, smoothLen), "Smoothed", orange)
The call
peer = req.symbol("NIFTY", "1D", close, exchange = "NSE_INDEX")
plot(peer, "NIFTY, last closed day", style = "step")| Argument | Type | Means |
|---|---|---|
symbol | string | The instrument to read, in OpenAlgo's symbol format |
timeframe | string | The interval to read it at, written as on Timeframes |
expr | any | The expression to compute on that instrument's bars |
exchange | string | Where it trades. Defaults to the chart's own exchange |
mode | string | "confirmed" (the default), "developing" or "lookahead", as on Higher timeframes. See which bar a read gives you |
Symbols are written the way OpenAlgo writes them everywhere:
| Instrument | Symbol | Exchange |
|---|---|---|
| An NSE or BSE stock | The base symbol, such as SBIN or RELIANCE | NSE or BSE |
| An index | NIFTY, BANKNIFTY, SENSEX | NSE_INDEX or BSE_INDEX |
| A future | Symbol, expiry as DDMMMYY, then FUT, such as NIFTY30JAN25FUT | NFO, BFO or MCX |
| An option | Symbol, expiry, strike, then CE or PE, such as NIFTY30JAN2521500CE | NFO or BFO |
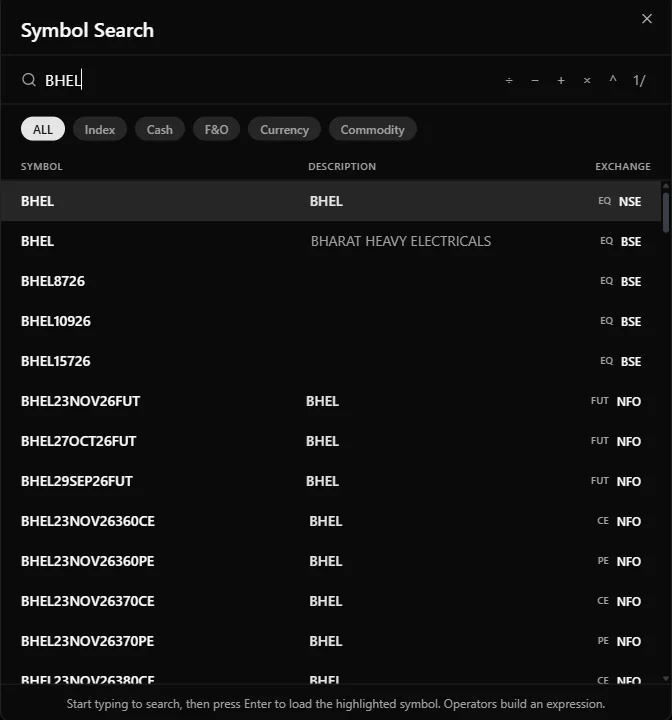
The chart's symbol search in /trading lists instruments in this format, with the exchange beside each one, so it is the quickest way to find the exact text to type into a symbol input.
Inside expr, the built-in series are the requested instrument's, at the requested interval. In req.symbol("NIFTY", "1D", ema(close, 20) > ema(close, 50), exchange = "NSE_INDEX") both averages are computed from the index's daily closes. The same restrictions apply as in a higher timeframe read: a name from the rest of the file may be read inside expr only when it is fixed before the first bar (a literal or an input(), otherwise OS6003), and orders, drawings and alerts do not belong there.
Which bar a read gives you
The mode decides which of the other instrument's bars reaches each bar of your chart. A confirmed read only hands back a bar that has closed, and the engine counts the other instrument's newest bar as still forming until its next bar begins. At the chart's own interval, that puts a confirmed read one bar behind.
| Mode | At the chart's own interval, a chart bar gets | On a chart bar where the other instrument has no bar |
|---|---|---|
"confirmed", the default | The other instrument's previous bar, even when both instruments traded in this one | An earlier value, held |
"developing" | The other instrument's bar at the same time | absent |
On a five minute chart, at the 10:00 bar, a confirmed read of close is the other instrument's 09:55 close, and a developing read is its 10:00 close. Where the other instrument has no 10:00 bar, the confirmed read still holds its 09:50 close at 10:00, because its 09:55 bar only counts as closed once the next bar begins, and the developing read is absent.
Compare two instruments at the same instant with mode = "developing". A ratio, a spread or a sum of option legs is only meaningful when both sides are the same bar, and a confirmed read at the chart's own interval never is. The price is the one the mode's name admits. On history every value is final, but on the live chart the other instrument's bars arrive by fetch, which the /trading chart repeats as each new chart bar begins, so the newest values, the bar that has just closed included, can still change when that fetch lands. That is fine for a line you read. Think twice before an alert or an order acts on it, as Repainting explains.
Keep the default for a coarser read. req.symbol("NIFTY", "1D", high, exchange = "NSE_INDEX") is the high of the last day that closed, which is what "yesterday's NIFTY high" means, and it never moves.
The symbol is fixed before the first bar
The host fetches each requested series once, keyed by its symbol, exchange and timeframe, and keeps it in step with the chart. So the symbol comes from a literal or an input, never from bar data:
// Refused: the symbol depends on this bar's prices.
name = close > open ? "SBIN" : "INFY"
other = req.symbol(name, chart.interval, close)
plot(other, "Other")
A dedicated instrument picker, input(..., kind = "symbol"), is planned. It is not in this version, and the compiler says so:
leg = input("", "Second leg", kind = "symbol")
plot(close, "Close")
Until it lands, take the symbol as a plain text input, as the example at the top does, and the settings dialog shows a text box to type it in.
Waiting for the answer
A read of another instrument cannot finish until the host supplies that instrument's bars, and that takes a moment. While it is outstanding:
- the read is absent, on every bar,
- everything in the study that does not depend on the read keeps drawing,
- and when the bars arrive, the study is calculated again over its whole history with the read present.
A chart that showed a broken line for a second and then a complete one did not repaint. It had not been answered yet, and the gap was the honest statement of that.
Two functions report on a read. Assign the read to a name and pass the name:
| Call | Returns | Means |
|---|---|---|
req.isReady() | series bool | The host has answered |
req.error() | series string | Why the read failed, as a sentence, or "" |
A read that fails stays absent, and the reason is available to the script through req.error. These are the codes a host can report:
| Code | When | The message carries |
|---|---|---|
| OS6007 | The host does not know the symbol on that exchange | The symbol and the exchange |
| OS6008 | The instrument exists and had no bars over the chart's range | The symbol and the interval |
| OS6009 | The data source refused or did not answer | The source's own reason |
| OS6014 | The data source does not store that interval for the instrument | The intervals it does serve |
| OS5006 | The file makes more reads than the host allows | How many it makes and how many are allowed |
On the /trading chart, a fetch the data source refuses reports OS6009 with the source's own words, which is how a misspelt symbol usually shows up, and a fetch that returns no bars reports OS6008.
OS6007 exists, rather than an empty series, because an empty series looks exactly like an instrument that did not trade, and those two situations call for opposite responses from the person reading the chart.
A study that says what state it is in
version 1

study("Peer comparison", precision = 2)

peerName     = input("NIFTY",     "Instrument to compare")
peerExchange = input("NSE_INDEX", "Its exchange")

peer  = req.symbol(peerName, chart.interval, close, exchange = peerExchange, mode = "developing")
ready = req.isReady(peer)
why   = req.error(peer)

// Computed on every bar. An unanswered read gives an absent ratio and a gap.
ratio = close / peer
plot(ratio, "This instrument over the peer", aqua, width = 2)

// A study whose data has not arrived says so, rather than leaving an empty pane.
panel = table("Status", 2, 2, position = "topRight", textColor = silver)
if bar.isLast
    cell(panel, 0, 0, "Peer")
    cell(panel, 0, 1, peerName, textColor = white)

    cell(panel, 1, 0, "State")
    cell(panel, 1, 1, why != "" ? why : (ready ? "ready" : "loading"),
         textColor = why != "" ? red : (ready ? lime : silver))
Alignment by timestamp
The expression is computed on the other instrument's own bars, at the requested interval, and the result is then placed on the chart's bars. The chart's bars are always the time axis.
- Alignment is by instant.
timeis UTC milliseconds, so two instruments align correctly with no timezone arithmetic anywhere. - What the other instrument did between two chart bars is not visible except through what the expression computed. If the detail matters, read a finer interval or put the chart on one.
- A time when only the other market is open has no chart bar to land on. An MCX contract read on an NSE chart shows nothing of its evening trade.
How a developing read at the chart's own interval behaves bar by bar:
| Situation on a chart bar | What the read gives |
|---|---|
| Both instruments traded in that bar | The other instrument's value for that bar |
| The other instrument did not trade in that bar | absent |
| The other instrument's market is closed while the chart's is open | absent |
| The read has not been answered yet | absent, with req.isReady false |
A confirmed read never goes absent once it has a first value. Where the other instrument has no bar, it holds an earlier one, and after the other market closes for the day it keeps holding until that market's next bar begins.
What a missing bar means
In a developing read, an absent bar is absent. It is not zero, it is not the previous value carried forward, and it is not an error. The language promises one thing about it: any arithmetic touching an absent value is absent, all the way to the plot, where it draws a gap.
That promise is what makes a combined option premium trustworthy. If one leg of a straddle has no bar at this instant, the sum of the two legs is absent. It is not the other leg's price. A sum that quietly dropped the missing leg would show the premium halving, which reads on the chart as a profitable decay and is in fact a data gap. A confirmed read would not drop the leg, but it would add this bar's price of one leg to an older price of the other, which is wrong in a way no gap shows.
Why a bar can be missing:
| Cause | Typical shape |
|---|---|
| The instrument did not trade in that bar | A far strike or a thin contract, with gaps through the day |
| The two markets keep different hours | An MCX contract read on an NSE chart, or the other way round, absent at one end of the day |
| A holiday on one exchange and not the other | A whole day absent |
| The contract had not been listed yet | Absent at the left edge, then present; OS6008 when the whole range is empty |
| The contract has expired | Present at the left edge, then absent |
Filling a gap, deliberately
Sometimes holding the last known value is what you want: a slow instrument read against a fast one, where a one bar gap is noise. A developing read will not do it for you, because holding a stale value is a decision with a cost. Make the decision in the open, and show where it was made:
version 1

study("Peer, held through gaps", precision = 2)

peerName     = input("NIFTY",     "Instrument to compare")
peerExchange = input("NSE_INDEX", "Its exchange")
maxStale     = input(5, "Hold a stale value for at most this many bars", min = 1, max = 100)

peer = req.symbol(peerName, chart.interval, close, exchange = peerExchange, mode = "developing")

present = not isNone(peer)

// valueWhen holds what the read said the last time it said anything, and
// barsSince says how many bars ago that was.
lastKnown = valueWhen(present, peer)
staleness = barsSince(present)

// The held value is used only while it is fresh enough.
usable = not isNone(staleness) and staleness <= maxStale
held = usable ? lastKnown : none

plot(peer, "Peer, as read", aqua, width = 2)
plot(held, "Peer, held", fade(aqua, 60), style = "step")

// Held bars are shaded, so nobody mistakes memory for data.
background(present ? none : (usable ? fade(orange, 90) : fade(red, 92)))
Three things in that script are worth copying: the raw read is plotted as well, so the gaps stay visible; the hold has a limit, so an expired contract cannot draw a flat line forever; and the held bars are marked. valueWhen() and barsSince() have the details.
The cost of a read
| Cost | Size | What to do about it |
|---|---|---|
| One fetched series per symbol, exchange and timeframe | A host may set a ceiling, OS5006 when exceeded; the /trading chart sets none today | Make one read per series, assign it to a name, reuse the name |
| Waiting for the answer | One fetch when the study loads | Draw what does not depend on it, and show the status |
| A recalculation when the answer arrives | The whole history, once | Nothing: it is the correct behaviour |
| Reading the answered series on each bar | A lookup | Nothing |
The rule that falls out of the table: a read is expensive and arithmetic is not. Derive everything you can from the reads you already have.
// Two reads, and the midpoint worked out from them rather than read a third time.
dayHigh = req.symbol("NIFTY", "1D", high, exchange = "NSE_INDEX")
dayLow  = req.symbol("NIFTY", "1D", low,  exchange = "NSE_INDEX")
dayMid  = (dayHigh + dayLow) / 2
plot(dayMid, "NIFTY previous day mid", style = "step")
Chart facts describe the chart's instrument
chart.tickSize, chart.lotSize, chart.exchange and the rest of the chart namespace describe the instrument the chart is showing, never the one a read names. There is no per-read equivalent, so a study that reads another instrument and needs its lot size takes it as an input and says so in the title.
On the /trading chart, a study is not told the chart instrument's exchange or lot size either, so chart.exchange and chart.lotSize are absent there. Take a lot size as an input whenever a study works in money.
Index against its future
The gap between a future and its index, the basis, is positive when the future trades above the index. Put this study on the chart of the index, such as NIFTY, and type the current month's contract:
version 1

study("Futures basis", precision = 2)

futName     = input("", "Future, such as NIFTY30JAN25FUT")
futExchange = input("NFO", "Exchange of the future")

// The future's bar at the same time as the index bar, so the difference is
// taken between two prices of one instant.
fut   = req.symbol(futName, chart.interval, close, exchange = futExchange, mode = "developing")
basis = fut - close

level(0, "Zero", gray)
plot(basis, "Basis", aqua, width = 2)
plot(sma(basis, 20), "Basis, 20 bar average", orange)
The basis is empty until the future is typed in, and absent on any bar the future did not trade.
A worked example: two legs, one number
This study adds two option legs into one combined premium, holds the day's first premium as a reference, and marks when the premium has decayed by a chosen percentage. Put it on the chart of the underlying, such as the NIFTY index, and type the two legs in OpenAlgo's format.
version 1

study("Combined premium", precision = 2, format = "price")

callLeg     = input("", "Call leg, such as NIFTY30JAN2521500CE")
putLeg      = input("", "Put leg, such as NIFTY30JAN2521500PE")
legExchange = input("NFO", "Exchange of the legs")
lots        = input(1,  "Lots", min = 1, max = 100)
lotSize     = input(1,  "Units in one lot", min = 1)
targetPct   = input(30, "Decay to mark, in percent of the opening premium", min = 1, max = 99)

// Both legs at the chart's own interval and in the developing mode, so each
// chart bar gets both legs' bars at that same time and the sum below is a sum
// of one instant.
callPrice = req.symbol(callLeg, chart.interval, close, exchange = legExchange, mode = "developing")
putPrice  = req.symbol(putLeg,  chart.interval, close, exchange = legExchange, mode = "developing")

// If either leg has no bar at this instant, the sum is absent, not half a position.
premium = callPrice + putPrice
money   = premium * lots * lotSize

// A new trading day in IST. NSE sessions never cross midnight, so a new date
// is a new session.
newDay = isNone(time[1]) or not date.isSameDay(time, time[1], "Asia/Kolkata")

var opening = none
if newDay
    opening = none
if isNone(opening) and not isNone(premium)
    opening = premium

// Positive when the seller of both legs is ahead.
decay = isNone(opening) ? none : (opening - premium) / opening * 100

plot(premium, "Combined premium", orange, width = 2)
plot(opening, "Opening premium", fade(silver, 40), style = "step")
plot(money,   "Position value", aqua, scale = "left")

if decay >= targetPct
    alert("Combined premium decayed " + text(decay, 1) + " percent", id = "decay-target")
    signal("TARGET")
decay >= targetPct is absent on any bar where either leg is missing, and an absent condition takes the false branch, so neither the alert nor the marker fires on a gap. The premium stays empty until both legs are filled in. The lot size is an input because it is the legs' lot size, not the chart's, and because exchanges revise lot sizes: enter the current one for your contract.
The alert and the marker act on developing reads, so on the live chart they see the legs' prices as last fetched when the bar closes. Treat the alert as a prompt to look at the premium, not as an instruction to trade.
On the /trading chart in this release, the marker draws as described, but the script's own alert() may not fire while the market is open: the chart judges a script's alerts once, when a bar first arrives, before it has closed. To be told reliably, plot decay >= targetPct ? 1 : 0 as well and put a study alert on that plot, as Alerts on a script condition shows.
Other instruments in /trading
| Where the script runs | What happens to req.symbol |
|---|---|
| On the chart, as a study | The read is fetched through the same data feed the chart uses. A read that names no exchange is asked on the chart's own exchange |
| In the Backtest panel | The run is refused before its first bar with OS6006: the backtest holds only the chart's own bars and cannot fetch another instrument |
On a /trading chart of minute or hour bars, reading at chart.interval works as the examples show. /trading names its daily interval D, which is not a timeframe the language reads, so a read at chart.interval on a daily chart stops with OS6001 when the study loads. On a daily chart write "1D" as the read's timeframe instead.
Mistakes worth naming
- Comparing with a confirmed read at the chart's own interval. It is one bar behind, so a ratio, a spread or a sum of legs mixes two different bars. Write
mode = "developing". - Treating an absent read as zero.
orElse(peer, 0)compiles and is almost never right: a price of zero is a price, and it wins everyminand loses everymaxit enters. - Deriving a symbol from bar data. Refused with OS3003. Symbols come from literals and inputs.
- Two reads of the same series. One of them is waste, and both count against any ceiling the host sets.
- Assuming the other instrument keeps the chart's hours. An MCX contract trades into the evening and an NSE stock does not, and the difference shows up as absent bars at one end of the day.
- Using
chart.lotSizefor a leg. It describes the chart's instrument, whatever the read names.
Related: Higher timeframes, Repainting, Sessions and time, Absent values, req.* reference