
Timeframes
The chart's interval, how a timeframe is written, and how to make a study mean the same thing on a one minute NSE chart and on a daily one.
On this page
Every script in OpenScript (also called OpenAlgo Script) runs on the bars of one chart, and the chart's interval decides how much trading each bar covers. This page shows how to read that interval from inside a script, how a timeframe is written when you ask for one, and how to convert a period you think of in minutes into a count of bars. It matters because almost every library call counts in bars, so a study tuned on a five minute chart can mean something quite different when you drop it on a daily one.
What an interval is
The chart hands the engine (the part of OpenScript that runs your script, once per bar) a list of bars, oldest first, and the interval is the rule that decided where one bar ended and the next began. On a five minute chart of an NSE stock, each bar covers five minutes of trading, and a full 09:15 to 15:30 IST session holds 75 of them. On a daily chart, each bar covers one whole session.
Two facts about a bar sit under everything on this page:
- A bar covers a known span of time. Every bar carries
time, the instant it opened, as milliseconds since 1 January 1970 in UTC.timeClose, the instant a bar ends, is planned and not available yet, so a script that needs the end of a bar adds the interval totime. - The newest bar is not finished. Until its interval has elapsed, its
closeis the last traded price rather than a closing price, andbar.isConfirmedisfalse. Realtime and confirmation covers what that means for signals and orders.
Clock intervals and calendar intervals
Minutes and hours are measured by the clock. Days, weeks and months are measured by the calendar and by the instrument's session.
A daily bar is not 1440 minutes of trading. It is one session, which is 375 minutes on NSE and BSE, a much longer day running into the late evening on MCX, or a shorter day when the exchange closes early. A monthly bar is 28 to 31 days depending on the month.
chart.intervalMinutes is the interval's nominal length in minutes, worked out from how the interval is written. It is 5 on a "5m" chart, 1440 on a "1D" chart and 10080 on a "1W" chart. A month has no fixed length, so on a "1M" chart it is absent. chart.isIntraday is true only for an interval shorter than one day.
| Interval | Measured by | chart.intervalMinutes | chart.isIntraday |
|---|---|---|---|
"1m" to "4h", and any count of minutes | The clock | The interval in minutes | true |
"1D" | The session | 1440 | false |
"1W" | The calendar | 10080 | false |
"1M" | The calendar | absent | absent |
An interval the language cannot read, such as "D" | Unknown | absent | absent |
The 1440 of a daily chart counts clock minutes, not trading minutes, so never divide by it to count time the market was open. The last row matters in /trading, which names its daily chart D: see the last section.
How a timeframe is written
When a script names a timeframe, for a higher timeframe read or an interval input, it writes a count and a unit as a string.
| Written | Means |
|---|---|
"1m", "5m", "15m", "75m" | Minutes |
"1h", "2h", "4h" | Hours |
"1D" | Days |
"1W" | Weeks |
"1M", "3M" | Months |
"60" | A bare number is minutes, so this is the same as "1h" |
Two rules to hold on to:
- The unit letter is case sensitive.
"1M"is one month and"1m"is one minute. Minutes and hours are written in lower case and days, weeks and months in upper case, so"1d","1w"and"1H"are not timeframes, and neither is a unit with no count, such as"D". - A bare number is minutes. That form exists so that a script can pass on an interval written as a plain count of minutes without reformatting it.
A string written in the source that is not one of these forms is refused by the compiler with OS6001, naming the value:
// "1d" is not a timeframe: the day unit is an upper case D.
dayHigh = req.timeframe("1d", high)
plot(dayHigh, "Day high")
Reading the chart's own interval
Four values describe the interval the script is running on. They live in the chart namespace.
| Value | Type | Holds |
|---|---|---|
chart.interval | string | The interval as the host names it, for example "5m" |
chart.intervalMinutes | number | The interval's nominal length in minutes, absent for a month or an interval the language cannot read |
chart.isIntraday | bool | Whether the interval is shorter than one day, absent where chart.intervalMinutes is |
chart.timezone | string | The zone the chart's time axis is labelled in, such as "Asia/Kolkata" |
These are plain values, not series. The interval is the same for the whole run, because changing the chart's interval loads different bars and starts a new run. So they carry no history, and chart.interval[1] is refused with OS2004. That constancy is also what makes it safe to branch on them at the top level of a file.
version 1

study("What am I running on", overlay = true)

// A table is declared once, before the first bar. Only its cell contents
// change from bar to bar.
panel = table("Chart", 3, 2, position = "topRight", textColor = silver)

// Written only on the newest bar: the panel shows one state, the current one.
if bar.isLast
    cell(panel, 0, 0, "Interval")
    cell(panel, 0, 1, chart.interval, textColor = white)

    cell(panel, 1, 0, "Minutes per bar")
    cell(panel, 1, 1, isNone(chart.intervalMinutes)
                      ? "not known"
                      : text(chart.intervalMinutes, 0))

    cell(panel, 2, 0, "Intraday")
    cell(panel, 2, 1, chart.isIntraday ? "yes" : "no")
The absent case is written out rather than left to text(), because text(none) is the string "none", and a panel that reads "none" does not tell anyone why.
A length in bars is not a length in time
Almost every library call takes a length in bars. sma(close, 20) averages twenty bars, whatever a bar is on this chart. That is the right default, because a bar is the unit a study is drawn in, but it means the same script covers a different span of time on every interval.
| Chart interval | sma(close, 20) covers |
|---|---|
"1m" | 20 minutes |
"5m" | 100 minutes |
"15m" | 5 hours, most of an NSE session |
"1h" | 20 hourly bars, about three NSE sessions |
"1D" | 20 sessions, about a month of trading |
None of those is wrong. The trouble starts when a length chosen because it worked on one interval is carried to another, where the same number means something else. Decide once which unit the study is really about, and say so in the input's title.
| The study is about | State the length in | Why |
|---|---|---|
| The shape of the last N bars | Bars | The pattern is made of bars |
| The last two hours of trading | Minutes, converted to bars | That is the unit the trader thinks in |
| The time since the day's first bar | Milliseconds from time | Neither bars nor a fixed clock span |
| Yesterday or last week | A coarser interval read | See Higher timeframes |
Converting minutes into bars
The arithmetic is one division. The three guards around it are what make it correct.
periodMinutes = input(120, "Average length, in minutes", min = 5, max = 1440)
barsWanted = max(1, round(periodMinutes / chart.intervalMinutes))
plot(sma(close, barsWanted), "Time based mean")
Guard one: the chart may not be an intraday one. On a "1D" chart the division is 120 by 1440, which rounds to 0 and is floored to 1, so the study quietly becomes a one bar average. On a "1M" chart, or a daily chart whose interval the language cannot read, chart.intervalMinutes is absent. Absence carries through the division and through max(), and sma() given an absent length draws nothing on any bar, with no error to say why. Test chart.isIntraday first, and treat an absent answer as "no" with orElse().
Guard two: a length must be a whole number of 1 or more. A fractional length is refused rather than truncated: the study stops on that bar with OS4003, because a length of 14.5 is a bug and rounding it quietly would hide the bug. So round it, then floor the result at 1, because round(0.4) is 0 and a length of zero stops the study the same way.
Guard three: the answer is exact only inside a session. Sixty minutes is twelve five minute bars while the market is open. It is not twelve bars across the overnight gap, a weekend or a holiday, because no bars exist in those spans. A bar count counts bars that traded, not wall clock time.
Here is the whole pattern in a script:
version 1

study("Time based mean", overlay = true, precision = 2)

periodMinutes = input(120, "Average length, in minutes", min = 5, max = 1440)

// One place decides what a chart the clock cannot measure means for this study.
// orElse, because chart.isIntraday is absent where the interval is not one the
// language can read, and absent should mean "not usable" here.
usable = orElse(chart.isIntraday, false)

// The length is computed on every bar and floored at 1, so sma() always gets a
// legal length. The output is hidden at the plot, with none, rather than by
// putting sma() inside a branch: a stateful call inside a branch advances only
// on the bars where the branch runs, which is warning OS8001 and a broken line.
barsWanted = usable ? max(1, round(periodMinutes / chart.intervalMinutes)) : 1
line = sma(close, barsWanted)

plot(usable ? line : none, "Time based mean", aqua, width = 2)

// A study that cannot say what it means on this chart says so, once.
note = table("Note", 1, 1, position = "bottomRight", textColor = silver)
if bar.isLast and not usable
    cell(note, 0, 0, "This study needs an intraday chart")
What the division produces for a 120 minute input:
| Chart interval | 120 divided by the interval | Rounded | Floored at 1 | Span really covered |
|---|---|---|---|---|
"1m" | 120 | 120 | 120 | 120 minutes |
"5m" | 24 | 24 | 24 | 120 minutes |
"45m" | 2.67 | 3 | 3 | 135 minutes |
"4h" | 0.5 | 1 | 1 | 240 minutes |
"1D" | 0.08 | 0 | 1 | Not used: chart.isIntraday is false, so the study hides itself |
The last two rows are the honest part. On a four hour chart, "the last two hours" cannot exist: the finest thing the chart knows is four hours, and one bar is the closest answer. If that is not acceptable for a particular study, test for it and hide the output, as the daily case does.
Measuring in milliseconds instead
time is UTC milliseconds, so the difference between two bars' times is a real duration, whatever number of bars sits between them. This study shades the first minutes of each trading day, and says the same thing on a one minute chart and a fifteen minute one:
version 1

study("First minutes of the day", overlay = true, precision = 2)

windowMinutes = input(15, "Window, in minutes", min = 1, max = 240)

// A new calendar day in India Standard Time. NSE, BSE and MCX sessions never
// run past midnight IST, so for them a new day is a new session.
newDay = isNone(time[1]) or not date.isSameDay(time, time[1], "Asia/Kolkata")

var dayOpen = none
if newDay
    dayOpen = time

// Milliseconds since the day's first bar, not a bar count.
elapsed = isNone(dayOpen) ? none : time - dayOpen
inWindow = not isNone(elapsed) and elapsed < windowMinutes * 60000

background(inWindow ? fade(silver, 92) : none)
plot(inWindow ? high : none, "High in the window", aqua, style = "step")
The language's own answer to "is this the first bar of the session" is session.isFirstBar. It depends on the host supplying the instrument's session hours, and Sessions and time explains where that works in /trading today and why this study tests the date instead.
Two units, two jobs:
| Measure in | Right when | Misleading when |
|---|---|---|
| Bars | The study is about the last N bars of price action | Across a session break, a holiday, or a feed with missing bars |
Milliseconds from time | The study is about a span of trading time | Across the overnight gap, where the span includes hours nobody traded |
Neither is right everywhere. What matters is that you choose, and that the choice is visible in the source.
Warmup moves with the interval
A call that needs len bars is absent until len bars exist, and there is no hidden warmup beyond that. When a length comes from a conversion, the number of empty bars at the left edge of the chart changes with the interval, and a reader who does not expect it may read the gap as a bug.
| Chart interval | periodMinutes | Length in bars | Absent bars at the start |
|---|---|---|---|
"1m" | 120 | 120 | 119 |
"5m" | 120 | 24 | 23 |
"1h" | 120 | 2 | 1 |
Warmups also add up. sma(ema(close, 10), 10) is absent until bar 18, because the inner call is absent for its first nine bars and the outer call then needs ten present values. A converted length that feeds a stack of calls can leave a long empty stretch on a fine interval. That is the study saying it does not have the data yet. Warmup has the full rules.
One study, two behaviours
Sometimes a study really has one behaviour for a chart the clock measures and another for a chart the calendar measures. Write both, and let the interval choose.
version 1

study("Interval aware range", overlay = true, precision = 2)

// Two inputs in two units, because there is no honest conversion between a
// month and a minute. The titles say which chart each one applies to.
barLookback    = input(20,  "Lookback on a daily or longer chart, in bars", min = 2, max = 500)
minuteLookback = input(240, "Lookback on an intraday chart, in minutes", min = 5, max = 1440)

// Declared before the if and updated inside it, so the name is visible after
// the block. chart.intervalMinutes is always a number when chart.isIntraday
// is true, and an absent chart.isIntraday skips the block, which keeps the
// bar lookback.
len = barLookback
if chart.isIntraday
    len = max(1, round(minuteLookback / chart.intervalMinutes))

top    = highest(high, len)
bottom = lowest(low, len)

topPlot    = plot(top, "Lookback high", aqua, width = 2, style = "step")
bottomPlot = plot(bottom, "Lookback low", orange, width = 2, style = "step")
fill(topPlot, bottomPlot, fade(aqua, 93))
The "step" style is deliberate. These two levels hold flat for bars at a time and then jump, when a new extreme is set or an old one leaves the lookback, so a sloping line between two values would draw prices that were never read. Draw any value that is held constant between updates as a step.
Where the interval is known in /trading
The chart's interval reaches a script differently depending on where in /trading it runs.
| Where the script runs | What it is told |
|---|---|
| On the chart, as a study | The chart's interval as /trading names it, and the chart's timezone |
| In the Backtest panel | Nothing about the interval. The run fetches bars of the chart's instrument at the chart's interval over the panel's dates, but chart.interval, chart.intervalMinutes, chart.isIntraday and chart.timezone are absent |
| In the Strategies panel | The interval the deployment names |
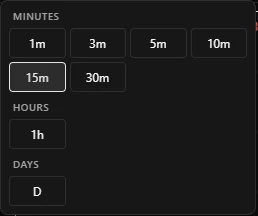
/trading names minute and hour intervals the way the language does, such as 5m, 15m and 1h, so on those charts every value on this page is present. Its daily, weekly and monthly charts are named D, W and M, which are not timeframes the language reads (it writes 1D, 1W and 1M). On a daily chart chart.interval is therefore "D", and chart.intervalMinutes and chart.isIntraday are both absent, which is why the examples above treat an absent chart.isIntraday as "not intraday".
Mistakes worth naming
- Dividing by
chart.intervalMinuteswith no guard. The study works on every intraday chart. On a daily one it quietly becomes a one bar average or draws nothing at all, and the reason is several lines away from the symptom. - Assuming
time - time[1]is the interval. It is, inside a session. At the day's first bar it is the overnight gap, on Monday it is the weekend, and after a holiday it is several days. Readchart.intervalMinuteswhen you need the interval. - Remembering a bar by its index. A bar index is a position in the history the engine was given, and every index shifts when older bars are loaded. Store the bar's
timeinstead, which never moves. - Passing a fractional length.
sma(close, 20 * 1.5)is 30 and fine.sma(close, len / 2)is not, for any oddlen. Round where the length is computed, so there is one place to read. - Using an interval input as a length. An interval input returns a timeframe string such as
"1h", not a number of bars. It belongs in a read, not in a length argument.
Related: Higher timeframes, Sessions and time, Repainting, Other instruments, Warmup, chart.* reference