
Language basics
The whole of OpenScript on one page, for someone new to it. How a script is laid out, names and literals, the price series, every operator with its precedence, past values, blocks, variables, functions and output, each with a link to the page that covers it in full.
On this page
This page is the whole language in one pass. OpenScript, also called OpenAlgo Script, is small: a script is a list of statements that runs once per bar, and everything below follows from that. Each section states the rules exactly and briefly, then links to the page that covers the topic in full. Read it top to bottom once, then keep it open as a map while you write your first scripts.
What a script is
A script is a text file written in OpenScript. It either draws on the chart (a study) or also places orders (a strategy). The engine that runs it executes the whole file once per bar, from the first line to the last, starting with the oldest bar on the chart and ending with the newest. There is no main function and no event handler: the file itself is the body of a loop over the bars.
Here is a complete script:
version 1
study("EMA 20", overlay = true)

plot(ema(close, 20), "EMA 20", orange)
On a 5 minute NIFTY futures chart, the engine runs these lines on the first bar of the history, then on the next, and so on up to the newest bar. On each run, close is that bar's closing price, ema() updates its average and plot() writes one value to the line.
You write scripts in the Scripts panel of the /trading page. Choose New script, type, and press Ctrl+S. Every save compiles the script, and the console under the editor lists each problem with its line, its error code and the fix. Then apply the script to the chart.
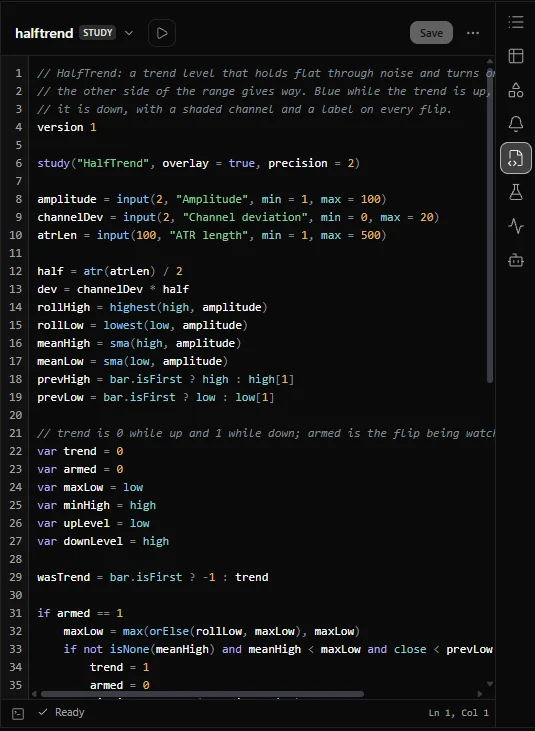
The Quickstart walks through those steps, and the Execution model explains the bar-by-bar run in full.
Lexical elements
The rules for how text becomes code: lines, indentation, comments, names and literal values.
Whitespace and newlines
A statement ends at the end of its line, and a line holds one statement. There is no statement separator: a ; is error OS1007. Spaces between tokens do not change the meaning, and the canonical layout puts one around an operator and none inside brackets (a + b, f(a, b), close[1]). Blank lines are ignored.
A file is UTF-8 text. Outside string literals, only ASCII letters, digits, spaces, newlines and the language's punctuation are allowed. A non-breaking space or a curly quotation mark pasted from a document is OS1001, reported at that character. Inside a string, any Unicode text is fine.
Indentation forms blocks
A block is a group of lines that belong to a header line such as if, else, for, while, switch, case, default or a multi-line fn. The block is every following line indented more deeply than the header, and it ends at the first line indented the same as the header or less. There are no braces and no end keyword.
upBar = false
if close > open
    upBar = true
    signal("UP")
background(upBar ? fade(lime, 92) : none)
The two indented lines belong to the if. The last line is back at the header's indentation, so it runs on every bar.
- Indent with spaces. A tab in the indentation is
OS1002. - Every line of one block carries exactly the same indentation. One space more or less is
OS1003. - Four spaces is the convention. Any amount deeper than the header is accepted.
- A header with no indented line after it is
OS1010. - Blank lines and lines that hold only a comment take no part in the rule, so they never open or close a block.
Line continuation
A long statement continues onto the next line in three cases:
- A
(or[is still open. - The line ends with a binary operator, a comma,
?,:or=. - The line ends with a backslash,
\.
trend = ema(close, 9) +             // ends with an operator
        ema(close, 21) +
        ema(close, 50)

spread = ema(close, 9) \
         - ema(close, 21)           // the backslash carried it here

plot(trend / 3, "Mean of three EMAs",
     color = aqua,                  // the bracket is still open
     width = 2)
plot(spread, "EMA 9 less EMA 21")
A continuation line must be indented more deeply than the line its statement began on, so it can never be read as a new statement. A continuation at the same indentation or less is OS1028.
Comments
A comment starts at // and runs to the end of the line. A // inside a string is ordinary text. There are no block comments: /* ... */ is OS1026, so comment out a region by putting // on each line.
// A comment on its own line.
len = 14                // A comment after code.
plot(sma(close, len), "SMA 14")
Identifiers
An identifier (a name) starts with an ASCII letter or an underscore and continues with ASCII letters, digits and underscores. Names are case sensitive, so fastLen and fastlen are two different names.
| Written | Result |
|---|---|
fastLength, _scratch, ema9 | Legal names |
2fast | OS1029: a name cannot start with a digit |
längd | OS1001: names are ASCII |
step, color, series | OS1019: reserved words |
close, plot, level | OS2002: library names, see Variables |
The convention, not enforced, is camelCase for names and functions, and UPPER_SNAKE for values you treat as constants.
Reserved words
These 36 words are reserved. None of them can be a variable, a function or a parameter name, and using one as a name is OS1019.
| Group | Words |
|---|---|
| Declarations | study, strategy |
| Control flow | if, else, for, to, step, in, while, break, continue, switch, case, default |
| Functions | fn, return |
| Persistence | var, live |
| Logic | and, or, not |
| Literals | true, false, none |
| Type names | number, string, bool, color, series, array |
| Reserved for a later version | as, import, is, map, matrix, type |
A reserved word is still legal as a named argument label, because a label is matched against the called function's parameters and is never looked up as a name. plot(x, "X", color = aqua) is correct. Keywords describes every word.
Literals
A literal is a value written directly in the source.
| Kind | Examples | Rules |
|---|---|---|
| Number | 42, 3.14, .5, 1_000_000, 2.5e-4, 0xFF | One numeric type, a finite 64-bit floating point value. Underscores group digits and mean nothing. 0x starts hexadecimal. There is no octal form, so 010 is ten. -2 is the minus operator applied to 2 |
| String | "BUY", 'He said "go"' | Double and single quotes mean the same thing. Escapes: \\, \", \', \n, \t, \r, \0 and \uXXXX. A string cannot span two lines |
| Boolean | true, false | Type bool. Not numbers: 0 is not false and 1 is not true |
| Colour | aqua, #ff8800, #ff880080 | One of nineteen named colours, or hex #rrggbb, or hex #rrggbbaa whose last byte is the alpha (opacity): ff is solid, 00 invisible. Any other number of hex digits is OS1027 |
| Absent | none | The value that means "there is no value here". See Series and past values |
An array is a list of values of one type, written in square brackets: [24000.0, 24500.0, 25000.0]. Its elements are read with [i], counting from 0, and Collections covers arrays. The named colours are aqua, black, blue, brown, fuchsia, gray, green, lime, maroon, navy, olive, orange, pink, purple, red, silver, teal, white and yellow.
Script structure has every layout rule, and Types and values covers each type in full.
Script structure
Every file has the same shape, in this order:
- The version line,
version 1: the first line that is not blank and not a comment. It fixes the language version, so the file keeps its meaning under every later release. It is optional, but without it the compiler warns withOS8003. Anything else above it isOS1021. - One declaration,
study("Title", ...)orstrategy("Title", ...). It names the script and sets options such asoverlay = true, which draws on the price pane instead of a pane of its own. Write it directly under the version line. A file with no declaration isOS2007, and a second one isOS2008. - An optional
limits(...)line, directly under the declaration, for scripts that need a larger loop budget or a bounded history. - Statements, run in order, top to bottom, once per bar.
version 1

study("Average with a setting", overlay = true, precision = 2)

len   = input(20, "Length", min = 2, max = 200)
basis = sma(close, len)

plot(basis, "SMA", orange)
input() makes len a setting you can change from the chart without editing the file. Because statements run in order, a name must be assigned above the line that reads it; reading it earlier is OS2001. Some calls declare the fixed shape of the study and must sit at the top level, never inside a block: plot(), fill(), level() and table() (OS3006), and input() (OS3007). To hide a plot on some bars, plot none there instead of wrapping it in an if.
Script structure covers each part, and Declarations lists every option of study() and strategy().
Price and bar values
A script reads the bar's prices by bare name, with no declaration. Each is a series number: one value per bar, and [n] reads an earlier bar.
| Name | Holds |
|---|---|
open | The price of the first trade in the bar |
high | The highest traded price in the bar |
low | The lowest traded price in the bar |
close | The closing price. On a bar still forming, the latest traded price |
volume | The quantity traded in the bar. Absent, not zero, where the host (the application feeding the bars, such as the /trading page) supplies none |
oi | Open interest: futures or options contracts outstanding at the end of the bar. Absent where none is supplied, as for a cash equity or an index |
hl2 | (high + low) / 2, the midpoint |
hlc3 | (high + low + close) / 3, the typical price |
ohlc4 | (open + high + low + close) / 4 |
hlcc4 | (high + low + close + close) / 4, the close counted twice |
time | The instant the bar opened, in milliseconds since 1 January 1970, UTC |
timeClose | The instant the bar's interval ends. Planned: using it today is OS2020. Until it arrives, write time + chart.intervalMinutes * 60000 on an intraday chart |
The bar namespace says where the script is in the run. These are the facts you will use most:
| Name | Holds |
|---|---|
bar.index | The bar's position in the loaded data. The oldest bar is 0 |
bar.count | Bars seen so far, bar.index + 1 |
bar.isFirst | true on the oldest bar only |
bar.isLast | true on the newest bar only |
bar.isConfirmed | true once the bar's interval has elapsed. Every historical bar is confirmed; the newest bar of a moving chart is not, until it closes |
version 1
study("Body as a share of the range", precision = 1)

body     = close - open
barRange = high - low
share    = barRange > 0 ? body / barRange * 100 : none

plot(share, "Body, percent of range", share >= 0 ? lime : red, style = "histogram")
background(bar.isConfirmed ? none : fade(yellow, 90))
The background marks the newest bar while it is still forming. Price and volume and bar.* document every value.
Operators
Arithmetic
+, -, *, / and % work on numbers. / is always real division, so 7 / 2 is 3.5. % is the remainder with the sign of the left operand, so -7 % 3 is -1. Division by zero gives none, not an error. There is no power operator: write pow(), as pow(x, 2).
+ also joins two strings, and does nothing else. There is no implicit conversion anywhere, so "Close " + 5 is OS2003. Convert with text(): "Close " + text(close, 2).
Comparison
<, <=, > and >= compare two numbers or two strings and give a bool. If either side is none, the result is none, not false.
== and != compare two values of the same type, and any value against none. They always answer true or false, so x == none is a working test for absence.
A comparison cannot be chained. a < b < c is OS1008; write a < b and b < c.
Logical
and, or and not take bool values. They use three-valued logic, where none means unknown, and and and or short-circuit: the right side runs only when it can still change the answer. !, && and || do not exist, and each is OS1001 with the word to use instead.
The conditional operator
cond ? a : b gives a when cond is true and b otherwise, including when cond is none. Both arms have the same type, or one arm is none; arms of two different types are OS2012. Only the chosen arm runs.
direction = close > open ? "up" : close < open ? "down" : "flat"
plot(direction == "up" ? 1 : 0, "Up bar")
Assignment and compound assignment
name = expression declares a name or updates it. The compound forms are shorthand: x += 1 is x = x + 1, and the same holds for -=, *=, /= and %=. Assignment is a statement, not an operator, so it has no place in the precedence table and if x = 5 is OS1006 (write == to compare). There is no ++ or --.
The history operator
src[n] reads the value of src from n bars ago, so close[1] is the previous bar's close and close[0] is close. On an array, the same brackets read an element: levels[0] is the first element. The compiler knows which from the type. Series and past values has the rules.
Precedence
Precedence decides which operator takes its operands first. Operators on a higher row bind more tightly.
| Level | Operators | Associativity | Notes |
|---|---|---|---|
| 1 | (expr), f(args), a[i], a.b | Left | Grouping, call, history or element, member |
| 2 | unary -, unary +, not | Right | |
| 3 | *, /, % | Left | |
| 4 | binary +, binary - | Left | + also joins strings |
| 5 | <, <=, >, >= | None | Cannot be chained |
| 6 | ==, != | None | Cannot be chained |
| 7 | and | Left | Short-circuits |
| 8 | or | Left | Short-circuits |
| 9 | cond ? a : b | Right | Only the chosen arm runs |
Left associative means a - b - c is (a - b) - c. Right associative means not not x is not (not x) and p ? a : q ? b : c is p ? a : (q ? b : c).
Parentheses group first, whatever the operators inside them:
a = 2
b = 3
c = 4
r1 = a + b * c          // 14: * binds before +
r2 = (a + b) * c        // 20: the parentheses group first
r3 = -a % b             // -2: unary minus first, then %
plot(r1 + r2 + r3, "Sum, which is 32")
The one trap: not binds more tightly than a comparison, so not close > open means (not close) > open, which is an error because close is a number. Write the parentheses:
downBar = not close > opendownBar = not (close > open)
plot(downBar ? 1 : 0, "Down bar")Operators explains each operator with examples, and the operator reference gives every operand type and result.
Series and past values
A series is the per-bar history of a value. Because the file runs on every bar, any name you assign at the top level holds one value per bar, just as close does: body = close - open is this bar's body on every bar.
[n] reads a series n bars back. It works on the built-in series, on any name assigned at the top level of the file, on a call that returns a series, and on a series parameter of your own function. Anything else, such as a name first assigned inside a block, is OS2004: assign the value to a top-level name first.
version 1
study("Bar to bar change", precision = 2)

barMove  = close - close[1]         // none on bar 0: no bar before it
prevMove = barMove[1]               // a top-level name has history too

plot(barMove, "Change", barMove >= 0 ? lime : red, style = "histogram")
plot(prevMove, "Previous change", gray)
On the first bars there is nothing to read: close[1] on bar 0 is none, and so is close[n] on any bar where n is greater than bar.index. The value is never clamped to the oldest bar and never zero. Absence follows a few fixed rules. Arithmetic and <, <=, >, >= with a none operand give none; == and != always answer true or false; a condition that is none takes the false branch of an if, a while or ? :; and a plot of none draws a gap. A library function that needs k bars returns none until it has them, which is all that warmup is: ema(close, 20) starts on bar 19. To replace an absent value with a fallback, use orElse(), and to test for one, isNone().
Bars and history, Absent values and Warmup cover each part.
Blocks and control flow
Control flow runs inside one bar: a loop repeats within the bar being computed, and the next bar starts from the top of the file again.
if and else
The condition must be a bool, or none, which takes the false branch. A number or a string is OS2011: 0 is not false and "" is not false, so write the comparison you mean. else if is two words on one line and does not add indentation.
barTint = gray
if close > open
    barTint = lime
else if close < open
    barTint = red
barColor(barTint)
switch
switch is a statement that runs one arm. The value form compares a subject with each case; the condition form, with no subject, takes the first case whose condition is true. Arms do not fall through, default is optional and comes last, and a case may list several values separated by commas. Declare any name the arms set before the switch.
style = input("intraday", "Trading style", options = ["scalp", "intraday", "swing", "positional"])

len = 21
switch style
    case "scalp"
        len = 9
    case "swing", "positional"
        len = 50

r = rsi(close, 14)
zone = 0
switch
    case r > 70
        zone = 1
    case r < 30
        zone = -1

plot(ema(close, len), "EMA")
plot(zone, "RSI zone")
for
for i = start to end counts with both ends included, so for i = 0 to 9 runs ten times. Add step n to change the increment; a descending loop must say step -1, and a range that runs the wrong way for its step does not run at all. for item in array visits each element. The loop variable belongs to the loop and cannot be assigned in the body (OS2006).
total = 0.0
for i = 0 to 9
    total += close[i]

levels = [24000.0, 24500.0, 25000.0]
below = 0
for lvl in levels
    if close > lvl
        below += 1

plot(total / 10, "Mean of the last 10 closes")
plot(below, "Round numbers below the close")
while
while repeats its block while the condition holds, checking it before each pass. A condition that becomes none ends the loop.
back = 0
while back < 50 and close[back + 1] < close
    back += 1
plot(back, "Lower closes in a row before this bar")
break and continue
break leaves the innermost for or while. continue skips to its next pass. Either one outside a loop is OS1009.
lastUp = -1
for i = 0 to 20
    if isNone(close[i])
        continue
    if close[i] > open[i]
        lastUp = i
        break
plot(lastUp, "Bars back to the last up bar")
Every loop iteration on a bar counts against a budget of 2,000,000 per bar; running past it is OS5001, and limits(loops = ...) raises it. Control flow covers every form and the budget.
Built-in functions
The library's everyday functions are bare names: ema(close, 20), rsi(close, 14), crossUp(fast, slow). The long tail sits behind a namespace and a dot, such as date.hour(time), str.length(s) or chart.symbol. The namespaces are bar, chart, session, date, str, math, pos, order, leg, book, draw and req.
- Named arguments. An argument can be given by its parameter's name, as
width = 2. Positional arguments come first, then named ones. A positional argument after a named one isOS3005, and a name the function does not have isOS3002, whose message lists the names that exist. - Defaults. A parameter with a default can be left out.
rsi(close)uses its default length of 14. Every reference entry shows the signature with its defaults, asrsi()does. - Nesting. A call can be an argument of another call:
ema(rsi(close, 14), 5)smooths the RSI.
version 1
study("RSI, smoothed", precision = 2, range = [0, 100])

r      = rsi(close)                 // len left out: the default, 14
longR  = rsi(close, len = 21)       // a named argument
smooth = ema(rsi(close, 14), 5)     // one call inside another

plot(r, "RSI 14", purple)
plot(longR, "RSI 21", color = gray, width = 1)
plot(smooth, "Smoothed RSI 14", orange, width = 2)
level(70, "Overbought", red)
level(30, "Oversold", lime)
Several outputs. An indicator with more than one line returns an array<number> holding this bar's values in a fixed order, and you read each by its position. macd() returns the MACD line, the signal and the histogram:
version 1
study("MACD", precision = 2)

m = macd(close)                     // [macd line, signal, histogram]

plot(m[0], "MACD", aqua)
plot(m[1], "Signal", orange)
plot(m[2], "Histogram", gray, style = "histogram")
Here m[1] picks an element, not a past bar. To read an element's history, name it first: sig = m[1], then sig[1].
A call that keeps state from bar to bar, such as ema(), belongs at the top level where it runs on every bar. Inside an if it advances only on the bars where the branch runs, and the compiler warns with OS8001. Compute it first, then use the result in the branch.
Technical analysis lists the multi-output functions, and the Reference section documents every function.
Variables
Assignment and reassignment
The first assignment to a name declares it; a later assignment updates it. The first value with a definite type fixes the name's type, so assigning a value of another type later is OS2003. A name first set to none takes its type from the first definite value assigned to it.
A plain name is recomputed on every bar. upNow = close > open starts fresh on each bar and remembers nothing from the last one, except through upNow[1].
var
var name = initial sets the value once, on the first bar the line runs, and then keeps whatever the name holds from bar to bar. The initial value is required: var total alone is OS1011, and var total = none is the empty start.
version 1
study("Up bars so far", precision = 0)

var upBars = 0                  // set once, on the first bar
if close > open
    upBars += 1                 // the var above, updated
plot(upBars, "Up bars so far", lime)
On the newest bar of a moving chart, the engine runs the bar again on each update and first restores every var to what it held at the end of the previous bar. A running count therefore counts bars, not updates, and matches a backtest over the same bars.
Block scope
A name first assigned inside a block belongs to that block and cannot be read after it:
if close > open
    body = close - open
plot(body, "Body")
Assign the name above the block, and the block updates it instead:
body = 0.0
if close > open
    body = close - open
plot(body, "Body of up bars")
No shadowing
A name exists once. Declaring a name in an inner scope when the same name exists outside it is OS2002, with the line of the outer declaration in the message. Inside a function body, assigning a name that the file already declares is a second declaration of it, so it is OS2002 too.
threshold = 70
if close > open
    var threshold = 80
The library's names, its series, functions and colours, count as outside names. So a library name such as level, plot, close, count or signal cannot be reused as a variable name, and trying is OS2002:
level = 70Pick a name the library does not use, such as upperLevel or upCount. Variables and scope and Persistence cover the rules in full.
User functions
fn declares a function of your own. The one-line form writes the result after =>. The block form ends with an expression, which is the result; return leaves early. Parameters may have defaults and optional type annotations.
version 1
study("Z-score of the close", precision = 2)

fn barChange(src) => src - src[1]

fn zscore(src, len = 20) =>
    m = sma(src, len)
    s = stdev(src, len)
    (src - m) / s

z = zscore(close)
plot(z, "Z-score", aqua)
plot(barChange(z), "Change in z-score", gray)
level(0, "Mean", gray)
A function is declared at the top level and can be called above its declaration. It cannot call itself (OS2005), because state such as a var or an ema() inside it is kept separately for each place it is called. User functions covers parameters, return values and per-call state.
Output
Five calls cover most of what a study shows. The first three declare fixed parts of the study and sit at the top level. The last two can go anywhere, typically inside an if.
| Call | What it does | Where |
|---|---|---|
plot() | Draws one value per bar as a line, step, area, histogram or column. The title is required | Top level only |
fill() | Shades the region between two plots. It takes the handles plot() returned, not values | Top level only |
level() | Draws a horizontal line across the pane at the price from the last bar | Top level only |
signal() | Puts a named marker on this bar | Anywhere |
alert() | Raises an alert with a message built on this bar | Anywhere |
A signal and an alert on a bar that is still forming wait for the bar to close, so they fire only on the final values.
version 1
study("Band breakout", overlay = true, precision = 2)

bb    = bollinger(close, 20, 2)     // [basis, upper, lower]
basis = bb[0]
upper = bb[1]
lower = bb[2]

pUpper = plot(upper, "Upper band", aqua)
pLower = plot(lower, "Lower band", aqua)
plot(basis, "Basis", orange)
fill(pUpper, pLower, fade(aqua, 90))

level(highest(high, 50), "50 bar high", gray)

if crossUp(close, upper)
    signal("BREAKOUT", color = lime, at = "below", shape = "arrowUp")
    alert(chart.symbol + " closed above the upper band at " + text(close, 2), id = "band-breakout")
On a 15 minute chart of an NSE stock, this draws the band, shades it, marks the highest high of the last 50 bars, puts an arrow on each bar that closes above the band, and raises an alert for it (Alerts from scripts explains when a script's alert fires on the /trading chart). Visuals covers everything a script can draw, including bar colours, backgrounds, drawing objects and tables, and Alerts from scripts covers alerts.
Study or strategy
A study and a strategy are the same language; the only difference is the declaration and what it allows. A study() computes and draws. A strategy() accepts every study option, adds trading options such as capital and qty, and may place orders with buy(), sell() and close() and read its own position with pos.*; an order call in a study is OS7001. Because one file holds both the plotted and the traded numbers, they cannot disagree. Test a strategy in the Backtest panel, and then in sandbox trading (analyzer mode in OpenAlgo), before trading it with real money.
version 1
strategy("EMA cross", overlay = true, qty = 1)

fast = ema(close, 9)
slow = ema(close, 21)
plot(fast, "Fast", aqua)
plot(slow, "Slow", orange)

if crossUp(fast, slow) and pos.isFlat
    buy()
if crossDown(fast, slow) and pos.isLong
    close()
Written as a call, close() is the order that flattens the position; read bare, close is the price. Your first strategy builds one step by step.
Where to next
- Quickstart: write, save and apply a first study in the /trading page.
- Your first strategy: turn a study into a strategy and backtest it.
- Example scripts: twelve complete scripts, explained.
- Execution model: the bar-by-bar run in depth.
- Absent values: every rule for
none, and the mistakes it prevents. - Inputs: make a script adjustable from the chart.
- Reference: every keyword, operator and library name.
- Errors: every error code, with its cause and fix.
- Glossary: the terms used across these pages.