
Tables
Pin a grid of readings to a corner of the chart with table() and cell(). Declare it once, write it on the newest bar, and align and colour it so it reads at a glance.
On this page
Almost everything a study produces is a value per bar, and a value per bar is a plot. A table is for the rest: readings that describe the current moment rather than a history. The latest RSI (relative strength index, a 0 to 100 momentum reading) and ATR (average true range, the typical size of one bar's move), the trend on three timeframes, where price sits in today's range. None of these has a shape on a time axis; each is read at a glance.
A table is also the one output that stays where you put it. It is pinned to a
corner of the pane, so unlike a stack of labels it does not move when price
moves. This page covers declaring a grid with table(), writing it with
cell(), when to write it, and how to align and colour it.
A complete dashboard
version 1
study("Dashboard", overlay = true)

rsiLen   = input(14, "RSI length", min = 2, max = 200)
atrLen   = input(14, "ATR length", min = 1, max = 200)
lookback = input(20, "Range lookback", min = 2, max = 500)
corner   = input("topRight", "Corner",
                 options = ["topLeft", "topRight", "bottomLeft", "bottomRight"])

// Declared once, at the top level, before the first bar.
panel = table("Readings", 7, 2, position = corner,
              textColor = silver, bgColor = fade(black, 25))

// Every reading is computed on every bar, outside the if below.
oscillator  = rsi(close, rsiLen)
atrPercent  = atr(atrLen) / close * 100
top         = highest(high, lookback)
bottom      = lowest(low, lookback)
rangePct    = top > bottom ? (close - bottom) / (top - bottom) * 100 : none
volumeRatio = volume / sma(volume, lookback)
trend       = ema(close, 20) > ema(close, 50)

fn show(value, decimals) => isNone(value) ? "warming up" : text(value, decimals)

zone = isNone(oscillator) ? "warming up" :
       (oscillator > 70 ? "overbought" : (oscillator < 30 ? "oversold" : "neutral"))
zoneColor = isNone(oscillator) ? silver :
            (oscillator > 70 ? red : (oscillator < 30 ? lime : silver))

// The panel shows one state, the current one, so it is written on the newest bar.
if bar.isLast
    cell(panel, 0, 0, chart.symbol, textColor = white)
    cell(panel, 0, 1, chart.interval, textColor = white, align = "right")

    cell(panel, 1, 0, "Trend")
    cell(panel, 1, 1, isNone(trend) ? "warming up" : (trend ? "up" : "down"),
         textColor = isNone(trend) ? silver : (trend ? lime : red), align = "right")

    cell(panel, 2, 0, "RSI")
    cell(panel, 2, 1, show(oscillator, 1), textColor = zoneColor, align = "right")

    cell(panel, 3, 0, "Zone")
    cell(panel, 3, 1, zone, textColor = zoneColor, align = "right")

    cell(panel, 4, 0, "ATR, percent of price")
    cell(panel, 4, 1, show(atrPercent, 2), align = "right")

    cell(panel, 5, 0, "Position in " + text(lookback, 0) + " bar range")
    cell(panel, 5, 1, isNone(rangePct) ? "warming up" : text(rangePct, 0) + " percent",
         align = "right")

    cell(panel, 6, 0, "Volume against average")
    cell(panel, 6, 1, show(volumeRatio, 2), align = "right",
         textColor = volumeRatio > 2 ? orange : silver)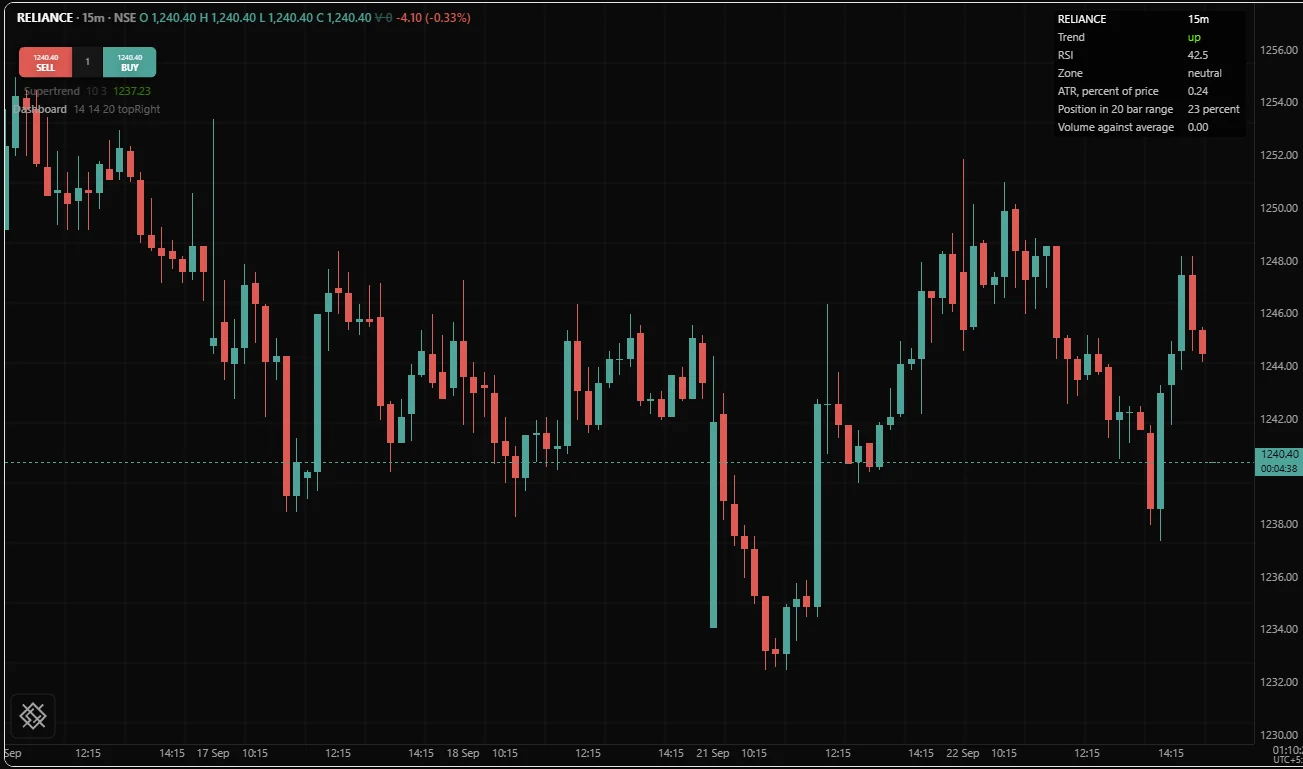
The screenshot shows a panel like this one on a 15 minute NSE chart. "Trend" is whether the 20 bar EMA (exponential moving average) is above the 50 bar one, "Position in 20 bar range" is where the close sits between the lowest low and the highest high of the last 20 bars (0 at the low, 100 at the high), and the last row compares this bar's volume with its 20 bar average.
Three habits in that script make a good panel, and the rest of this page explains each:
- The grid is declared at the top level, once, with a fixed size.
- The readings are computed at the top level and only the writing sits
inside the
if. A stateful call such asrsi()advances only on the bars where it runs, so one moved insideif bar.isLastwould see a single bar and return nothing. The compiler warns about that with OS8001. - The cells are written on the newest bar only, through one
showhelper that says "warming up" rather than leaving a blank or inventing a zero.
The first row reads chart.symbol and chart.interval, which the /trading
chart supplies. It does not yet supply chart.exchange or chart.lotSize,
so there both are absent: a cell built from either is blank, and show would
say "warming up" for ever.
Declaring a grid
table(title, rows, cols) declares a grid and returns the table you write into.
The optional arguments set where it sits and how it looks:
| Argument | Takes | Default |
|---|---|---|
title | string, the grid's name. It is not drawn on the chart | Required |
rows | A whole number of rows | Required |
cols | A whole number of columns | Required |
position | "topLeft", "topRight", "bottomLeft" or "bottomRight" | "topRight" |
textColor | The default text colour for every cell | none, the chart's default |
bgColor | The background behind the whole grid | none |
borderWidth | Border thickness, 0 for none | 0 |
table() must be at the top level. Like plot(), fill() and
level(), a table is part of the study's fixed shape: the pane has to know
what room to reserve before the first bar runs. A table() inside an if, a
loop or a function is OS3006:
if bar.isLast
    panel = table("Readings", 2, 2)
You never hide a table by wrapping it in a branch. You hide it by writing no cells, as switching a table off shows.
For the same reason, every argument of table() is settled before the first
bar. Each must be a literal, arithmetic over literals, or an input(); a value
that depends on bar data is OS3003:
rows  = bar.index > 100 ? 4 : 2
panel = table("Readings", rows, 2)
Make position an input, as the dashboard does. It costs one line, and which
corner is free depends on the reader's chart, not on your study. An input works
for the grid's colours too: bgColor = input(black, "Panel colour").
table() returns a table object, the same object on every bar. It can be named,
kept and passed to a function, and it is never deleted: the grid lives as long as
the study does.
One grid per study
A study may declare several grids and the compiler accepts it, but a chart pane
has room for one: the chart draws the first grid a study declares. A second
table() compiles and its cells are written, yet nothing appears for it, and no
diagnostic says so yet. Declare one grid and give it the rows you need. If you
want two panels, write two studies and put them in different corners.
Writing cells
cell(t, row, col, text) writes one cell of the grid t on this bar. Its
optional arguments style that one cell:
| Argument | Takes | Default |
|---|---|---|
textColor | The cell's text colour | none, the grid's textColor |
bgColor | The cell's background | none, the grid's bgColor |
align | "left", "center" or "right" | "left" |
Unlike table(), cell may appear anywhere: inside an if, a loop or a
function. All of its arguments, colours and alignment included, are read on
every bar, so a cell can change colour with the reading it shows.
Rows and columns count from zero, so a grid declared with 4 rows and 2 columns has rows 0 to 3 and columns 0 and 1. Writing outside the grid stops the script with OS4004, so keep the declared size and the rows you write in step. A second write to the same cell on the same bar replaces the first.
A helper function keeps a long panel short, because a table object can be passed to a function like any other value:
fn row(t, r, name, value) =>
    cell(t, r, 0, name)
    cell(t, r, 1, value, align = "right")

panel = table("Levels", 3, 2, position = "bottomRight")

if bar.isLast
    row(panel, 0, "High", text(high, 2))
    row(panel, 1, "Low", text(low, 2))
    row(panel, 2, "Close", text(close, 2))
Numbers in cells
The text of a cell is a string, and OpenScript never converts a number to text
on its own, so passing a number is OS3011:
panel = table("Readings", 2, 2)
cell(panel, 0, 0, close)
Convert with text(): text(value, decimals) writes a fixed number of
decimals. How it handles an absent value decides what a warming-up panel shows:
| You write | When the value is absent |
|---|---|
text(value, 2) | The result is absent, and the cell is blank |
text(value) | The result is the string "none" |
show(value, 2) with the helper | The cell says warming up |
A blank cell hides that the study has not started, and a zero would invent a number. Saying so is the only honest option, and one helper makes it consistent across the whole panel:
fn show(value, decimals) => isNone(value) ? "warming up" : text(value, decimals)Write on the newest bar
Cells do not carry over from one bar to the next. At the start of every run of a bar, the engine empties every grid, and the chart shows what the newest bar wrote. Three consequences follow:
- Write inside
if bar.isLast. Writing the panel on every bar of a fifty thousand bar chart is fifty thousand writes to show the last one.bar.isLastis true only on the newest bar. - A cell written only under some condition disappears on the bars where the condition is false. If the condition is false on the newest bar, the panel is empty. Write every cell you want to see on the newest bar.
- Nothing is ever left over. A panel that writes five rows on one bar and three on the next shows three.
The same rule makes a table safe while the newest bar is still forming. That bar runs again on every update, the grid is emptied each time, and the panel is rewritten from scratch rather than piling up.
Alignment and numbers that line up
The rule that makes a panel readable: labels left, numbers right. A
right-aligned column puts the last digit of every number at the same edge, so
with the same number of decimals the units line up and a longer number reads as
a bigger one. In a left-aligned column 9.50 and 11.25 start at the same place and
their decimal points do not line up. align defaults to "left", so pass
align = "right" on every value cell.
Inside one cell, str.repeat() turns a number into a bar drawn with
characters, which is often quicker to read than the number itself:
version 1
study("Strength meter", overlay = true)

barLen = input(10, "Meter width", min = 4, max = 40)

meter = table("Strength", 2, 2, position = "bottomRight", textColor = silver)

oscillator = rsi(close, 14)
strength   = isNone(oscillator) ? none : floor(oscillator / 100 * barLen)

if bar.isLast
    cell(meter, 0, 0, "RSI")
    cell(meter, 0, 1, isNone(strength) ? "" :
                      str.repeat("|", strength) + str.repeat(".", barLen - strength),
         textColor = oscillator > 70 ? red : (oscillator < 30 ? lime : aqua))

    cell(meter, 1, 0, "Value")
    cell(meter, 1, 1, isNone(oscillator) ? "warming up" : text(oscillator, 1),
         align = "right")
With the RSI at 64 and a width of 10, the meter reads ||||||..... floor()
is not decoration: str.repeat needs a whole number of copies, and given 6.4 it
stops the script with OS4003.
str.padLeft() and str.padRight() pad text to a number of characters.
They do not line numbers up in a cell: the chart draws cells in a proportional
font, where a space is narrower than a digit, and align is what lines a column
up. Padding is for text that must have a fixed number of characters, such as a
zero-padded hour: str.padLeft("9", 2, "0") is "09".
Colour in a table
Colour is set at three levels, each overriding the one above it:
| Level | Set by | Applies to | Can change per bar |
|---|---|---|---|
| The grid | table(..., textColor = ..., bgColor = ...) | Every cell that sets nothing itself | No, fixed before the first bar |
| The cell | cell(..., textColor = ..., bgColor = ...) | That cell | Yes |
| Neither | Leaving the arguments out | The chart's own default | Not applicable |
So a grid's colours are constants or inputs, and a colour that follows the data, such as red for overbought, goes on the cell.
Give the grid a translucent background rather than a solid one.
bgColor = fade(black, 25) keeps the candles behind the panel faintly visible,
which matters because the panel sits over the price pane; the same colour at full
strength punches a rectangular hole in the chart.
Colour in a cell is information, so spend it on the cell that carries the reading and not on the label beside it. A panel where every cell is coloured is a panel where nothing stands out. Colors covers colours that read well on both light and dark charts.
Headers and merged cells
There is no cell span in version 1: every cell occupies exactly one row and one column. For a header across a row, put the text in the first column, leave the rest blank, and give the whole row one background so it reads as a block:
panel = table("Bias", 4, 3)

if bar.isLast
    cell(panel, 0, 0, "Higher timeframes", textColor = white, bgColor = fade(navy, 40))
    cell(panel, 0, 1, "", bgColor = fade(navy, 40))
    cell(panel, 0, 2, "", bgColor = fade(navy, 40))
For a value that needs the width of two columns, design the grid with fewer,
wider columns. A grid has a fixed shape, so the clean fix for a value that does
not fit is usually a different shape. In return, every cell has exactly one
address, and cell(panel, r, c, ...) means the same thing on every bar.
Clearing and switching a table off
clear() empties every cell of a grid that has been written so far on this
bar. Since the grid starts every bar empty anyway, you need it only to discard
what the script has already written on the current bar and write something else
instead, such as replacing a full panel with one message:
panel = table("Readings", 3, 2)

if bar.isLast
    cell(panel, 0, 0, "Close")
    cell(panel, 0, 1, text(close, 2), align = "right")
    cell(panel, 1, 0, "Volume")
    cell(panel, 1, 1, text(volume, 0), align = "right")

    if not chart.isIntraday
        clear(panel)
        cell(panel, 0, 0, "Intraday charts only")
Switching a whole table off works the same way as hiding it: write no cells.
The table() call cannot sit in an if, but the writes can.
One detail decides whether that leaves the corner clean. The chart draws the
grid at its declared size whether or not anything was written, so a grid
declared with a bgColor or a borderWidth still shows as an empty block when
it holds no text. For a panel that can be switched off, leave the grid's own
background at none and give the background to the cells you write:
panel      = table("Readings", 1, 2)
showPanel  = input(true, "Show the panel")
shade      = fade(black, 25)
oscillator = rsi(close, 14)

// With showPanel off, nothing is written and nothing is drawn.
if bar.isLast and showPanel
    cell(panel, 0, 0, "RSI", bgColor = shade)
    cell(panel, 0, 1, text(oscillator, 1), bgColor = shade, align = "right")
A higher timeframe grid
The case a table is best at: several timeframes, one row each, each row saying the same thing about a different interval. This panel shows the EMA trend on three intervals the reader chooses:
version 1
study("Timeframe bias", overlay = true)

fastLen = input(20, "Fast length", min = 1, max = 500)
slowLen = input(50, "Slow length", min = 1, max = 500)
tfA     = input("15", "Timeframe 1", kind = "interval")
tfB     = input("60", "Timeframe 2", kind = "interval")
tfC     = input("1D", "Timeframe 3", kind = "interval")

grid = table("Bias", 4, 2, position = "topRight", bgColor = fade(black, 20))

// Each read waits for that timeframe's bar to close, so it never repaints.
biasA = req.timeframe(tfA, ema(close, fastLen) > ema(close, slowLen))
biasB = req.timeframe(tfB, ema(close, fastLen) > ema(close, slowLen))
biasC = req.timeframe(tfC, ema(close, fastLen) > ema(close, slowLen))

fn word(b) => isNone(b) ? "warming up" : (b ? "up" : "down")
fn tint(b) => isNone(b) ? silver : (b ? lime : red)

if bar.isLast
    cell(grid, 0, 0, "Timeframe", textColor = white)
    cell(grid, 0, 1, "Bias", textColor = white, align = "right")

    cell(grid, 1, 0, tfA)
    cell(grid, 1, 1, word(biasA), textColor = tint(biasA), align = "right")

    cell(grid, 2, 0, tfB)
    cell(grid, 2, 1, word(biasB), textColor = tint(biasB), align = "right")

    cell(grid, 3, 0, tfC)
    cell(grid, 3, 1, word(biasC), textColor = tint(biasC), align = "right")
word and tint both test isNone() first, and that is not caution for its
own sake. An absent condition takes the false branch, so b ? "up" : "down"
would print "down" on every row until the first higher timeframe bar closed. A
panel that says "down" when it means "not known yet" is worse than no panel.
Higher timeframes explains req.timeframe()
and why its default mode never repaints.
What a table is not for
| You want | Use | Because |
|---|---|---|
| A value per bar | plot() | A table shows one state, not a history |
| An event on a bar | signal() | A marker is attached to the bar it happened on |
| A running log of values | print() | The log takes a value per bar and draws nothing |
| A caption on a shape | draw.label() or a box's own text | It belongs with the thing it describes |
| Fifty rows of history | A backtest report or the log | A chart corner is too small to read it |
The last row is the one people push against. A table can be declared with fifty rows and filled with the last fifty bars, and it will work, and it will be unreadable at the size a chart corner allows. Charts are for shapes over time; a list belongs in the print log or a backtest report.
Common mistakes
| Symptom | Cause | Fix |
|---|---|---|
OS3006 on the table() line | Declared inside an if, a loop or a function | Declare at the top level and guard the cell writes instead |
OS3003 on the table() line | A size, corner or colour that depends on bar data | Use a literal or an input; put per-bar colour on the cell |
OS3011 on a cell call | A number passed where text is expected | text(value, decimals) |
OS4004 on a cell call | A row or column outside the declared grid | Declare enough rows, or check the index |
| The panel is empty | Cells written under a condition that is false on the newest bar | Write every cell inside if bar.isLast |
| A reading is blank | text(value, decimals) of an absent value | Use a show helper that says "warming up" |
| Every row says "down" on a fresh chart | An absent condition took the false branch | Test isNone first and say so |
| The chart is slow with a table on it | Cells written on every bar of history | Write inside if bar.isLast |
| The panel hides the candles under it | A solid bgColor | fade(black, 25) or similar |
| A second panel never appears | The chart draws only the first grid a study declares | Declare one grid, or split the study in two |
| Numbers do not line up | Cells are left aligned by default | align = "right" on the value column |
| An empty block stays in the corner with the panel switched off | The grid has a bgColor or a border, which is drawn at the declared size | Put the background on the cells you write instead |
| A cell is blank, or says "warming up" for ever, on the /trading chart | It reads chart.exchange or chart.lotSize, which the chart does not supply yet | Leave those readings out of a panel meant for the chart |
OS4003 on a str.repeat meter | A count that is not a whole number | Round it down with floor first |
Related. Labels and shapes for the stack
of labels a table replaces, Lines and boxes
for output that belongs on the chart rather than in a corner,
Colors for cell colours,
Bar colouring and backgrounds for
stating a regime in colour, and the reference entries table() and
cell().