
Backtesting
Running a strategy over history from the Backtest panel in /trading, choosing the range and the inputs, knowing how much history the first trade needs, and what the 0.5.0 backtest does and does not model.
On this page
- A strategy to backtest
- Running it from the Backtest panel
- The date range
- Settings: inputs and what the script declares
- What runs where
- Warmup: how much history the first trade needs
- What the 0.5.0 backtest does not model yet
- Reproducing a run
- What a run cannot tell you
- Mistakes that produce a beautiful, wrong result
A backtest runs a strategy over the bars of the chart you are looking at, one bar at a time, oldest first, exactly as the chart runs a study, and reports what the strategy would have done. This page covers running one from the Backtest panel in the /trading page of OpenAlgo: what to pick, how far back to reach, how much history the first trade needs before it means anything, and which parts of a strategy the 0.5.0 backtest does not model yet.
There is no separate backtest mode in the language and no backtest-only function. The file you backtest is the file you later deploy, and the only thing that differs between the two is where the orders go. In a backtest they go to a fill model over history, and nothing is sent anywhere.
A strategy to backtest
A backtest needs a saved script that declares strategy(). A study() places no orders, so it has no trades, no equity curve and no report. This one is complete: save it from the Scripts panel, open an NSE stock or an index future on a 5 minute chart, and it runs.
version 1

// Costs: one tick of slippage on every fill, and 0.023 percent of the traded
// value per fill, an illustrative intraday equity cost stack. Use your own.
strategy("EMA cross, costed", overlay = true, precision = 2,
         capital = 500000, qty = input(1, "Quantity", min = 1),
         fillOn = "nextOpen", slippage = 1,
         commissionType = "percent", commission = 0.023)

fastLen = input(9,  "Fast length", min = 1, max = 500)
slowLen = input(21, "Slow length", min = 2, max = 500)

fast = ema(close, fastLen)
slow = ema(close, slowLen)
goLong = crossUp(fast, slow)
goFlat = crossDown(fast, slow)

if goLong and pos.isFlat
    buy()
else if goFlat and pos.isLong
    close()

plot(fast, "Fast", aqua, width = 2)
plot(slow, "Slow", orange, width = 2)
Three choices in that declaration are worth copying into every strategy you test:
- The costs are filled in before the first run. Slippage and commission change every figure in the report, and a strategy you have already seen a clean equity curve for is a strategy you will argue with when the costs arrive. Costs and fills covers choosing them.
- The quantity is an input.
qty = input(...)hands the order size to whoever runs the script, so the Backtest panel offers it as a field. A script that writes a number,qty = 5, fixes the size and no panel can change it. A script that says nothing trades 1 unit. - The fill rule is the default.
fillOn = "nextOpen"fills a decision made at one bar's close at the next bar's open, which is the price you could actually have had.
Running it from the Backtest panel
Open Backtest from the toolbar on the right-hand edge of /trading. It sits between Scripts and Strategies, in the order the work happens: write, test, then run.
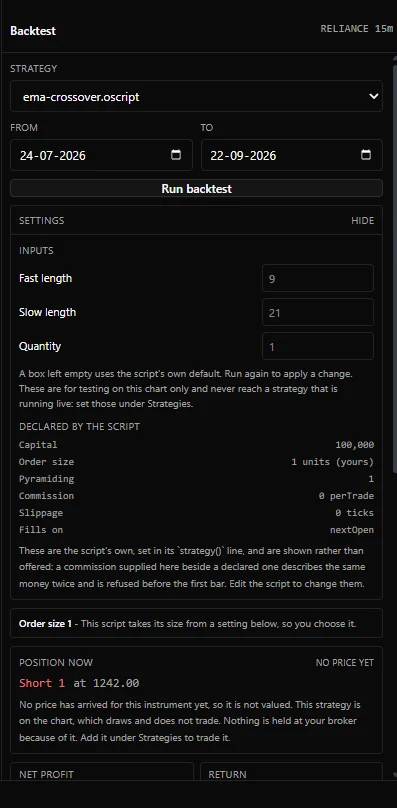
| Part of the panel | What it does |
|---|---|
| Header | Shows the symbol and interval of the chart the run is of, or No chart |
| Strategy | Lists your saved strategies, and only strategies. With none saved it reads No strategies saved |
| From and To | The range of bars the run covers |
| Run backtest | Starts a run with the current dates and inputs. It reads Running while one is going |
| Settings | The script's inputs, and what its strategy() line declares. Opens itself when the script has inputs; show and hide fold it |
The instrument and the interval are the chart's, not the panel's. There is no symbol box. A run is always of the instrument and interval on the chart beside it, read at the moment the run starts, so to backtest something else, change the chart. A backtest of something other than what you are looking at is the one result you would misread.
Three things start a run on their own: choosing a strategy in the list, changing the chart's instrument, and changing the chart's interval. Each of those changes what a run is of, and a report left on screen would otherwise describe something the chart no longer shows. Nothing else starts one. Edits to the dates and to the inputs wait for Run backtest, so you can make several before you mean any of them.
You can also start from the editor. In the Scripts panel, the Apply to chart button (the play icon beside the script's name) adds its plots to the chart and hands it to the Backtest panel, which opens and runs it over the chart's history. For a strategy that is what applying it means: the chart draws and does not trade, so the trades come from the run.
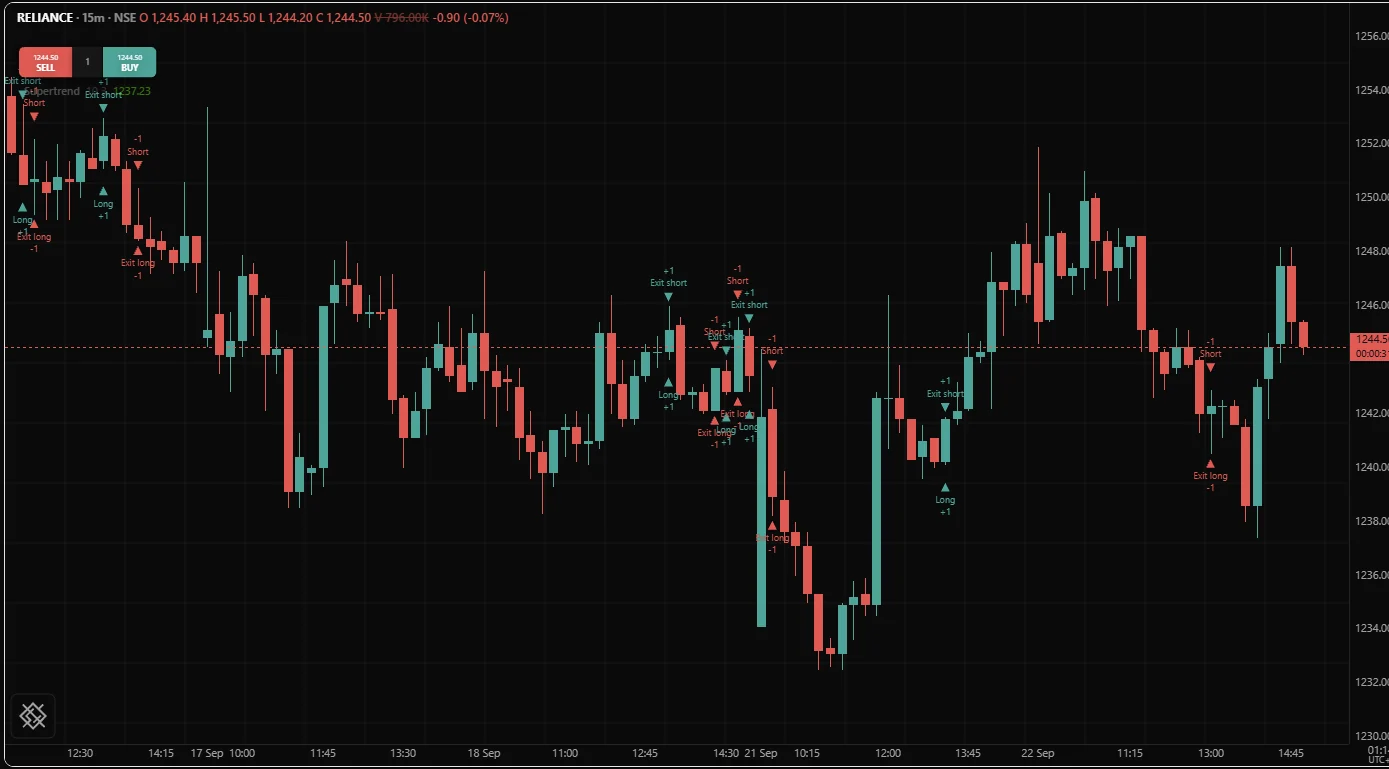
When a run finishes, its fills are marked on the chart, and the figures, the equity curve and the trade list appear under the controls. Reading a report goes through every one of them.
A run that cannot go ahead says why, in a box under the controls. A script that does not compile lists its first five diagnostics with their line and code. A run refused before its first bar shows the code and the reason, for example OS6021 for a quantity stated in cash. A range with no bars, or with too many, says that instead.
The date range
When the panel opens, the range ends today and reaches back by interval, because a range that is right for one interval is wrong for another:
| Chart interval | Default reach | Roughly how many bars |
|---|---|---|
| Minutes | Two months | About 40 sessions: 15,000 bars at 1 minute, 3,000 at 5 minutes |
| Seconds | Two months | At the finest second intervals that is more than the ceiling below, so shorten it |
| Hours | Two years | About 3,500 bars at 1 hour |
| Daily | Two years | About 500 bars |
| Weekly | Five years | About 260 bars |
| Monthly | Ten years | About 120 bars |
Once you type a date yourself, the range stops following the interval. A range you chose on purpose is not rewritten when you next change the timeframe.
A run covers at most 100,000 bars. An NSE session from 09:15 to 15:30 is 375 minutes, so the ceiling is a little more than a year of 1 minute bars. A longer range is refused before anything runs, with a message saying how many bars it held: shorten the range, or use a larger interval.
| Interval | Bars in one NSE session | 100,000 bars is about |
|---|---|---|
| 1 minute | 375 | 266 sessions |
| 5 minutes | 75 | 1,300 sessions |
| 15 minutes | 25 | 4,000 sessions |
| 1 hour | 7 | 14,000 sessions |
Choosing a range on purpose
The range decides what the result is a statement about. The calendar matters less than three other things.
Count trades, not days. A five year daily run of a strategy that trades twice a year is ten trades, and ten trades is an anecdote. Aim for a range that produces at least a hundred closed trades and treat anything under thirty as a sketch. If a hundred trades needs ten years of daily bars, test the idea on a finer interval or not at all.
Cover more than one regime. A range should contain at least one strong trend, one long sideways stretch and one fast fall, because those are the three shapes a strategy can be wrong in. A long-only run over a rising market tells you that the strategy was long during a rise.
Hold something back. Decide before you look at any result which part of the range you will not tune on. Developing on the first two thirds and checking on the last third is a common split, and any split chosen in advance is better than the best split chosen afterwards.
Two practical points. End the range on a bar that has closed, so no trade depends on a bar that was still moving. And keep the range fixed while you compare versions of a script: a change to the range and a change to the script in the same step means neither one is measured.
Choosing the interval
The interval is the resolution of every decision in the file, and the backtest sees four prices per bar and nothing inside them.
| Interval | What one bar hides | Where the honesty risk is |
|---|---|---|
| 1 to 5 minutes | Seconds. Spread and queue position dominate | Costs: a small edge per trade is eaten by the spread |
| 15 minutes to 1 hour | The path of price inside the bar | Stops and targets that both sit inside one bar |
| Daily | The whole session | A gap through a stop, filled far from its trigger |
| Weekly and longer | Weeks | Too few trades to say anything |
A coarser interval is not a slower version of a finer one. A 15 minute script run on 1 hour bars is a different strategy with the same source: its averages span four times the time and its signal count falls. Compare two intervals as two strategies. To read a coarser interval from a finer chart, use req.timeframe().
Settings: inputs and what the script declares
The Settings section has two halves.
Inputs. Every input() the script declares is a field, labelled with the input's own label. A true or false input is a two-way list, an input with options is a list of those options, and a number field carries the input's min, max and step. A field left empty uses the script's own default, and so does a number outside the input's own min and max: the panel drops it rather than sending it. A change takes effect on the next run, so press Run backtest after editing. These values are for testing on this chart only: they never reach a strategy that is running on the server, whose inputs are set under Strategies. A script with no inputs says so and suggests the line that would make a number adjustable.
Declared by the script. The capital, order size, pyramiding, commission, slippage and fill rule from the strategy() line, shown so you know what the figures rest on. They are shown and not offered: to change one, edit the script.
Under the settings, a line headed Order size says where the size comes from:
| The script | The panel says |
|---|---|
Wires qty to an input, as above | The size comes from a setting below, so you choose it |
Writes a number other than 1, such as qty = 5 | The script sets the size and it cannot be changed here |
Says nothing about size, or writes qty = 1 | It trades 1 unit, which is also the default, and the line qty = input(1, "Quantity", min = 1) would hand the choice to you |
State quantities in units. A strategy sized with qtyType = "cash" or "equityPercent" is refused by the 0.5.0 backtest before its first bar, and the OpenAlgo strategy runner sends only quantities stated in units. On an NFO future or option, a quantity in units is the number of units, so one lot of a contract whose lot size is 75 is qty = 75. Position and sizing covers sizing from chart.lotSize.
The instrument's own facts
The run reads the instrument's tick size and lot size from the platform's own record of the symbol. The tick size is what a tick of slippage is worth and what chart.tickSize answers; the lot size is what chart.lotSize answers and what converts a quantity stated in lots. The line under the figures states both, for example Tick 0.05, lot 1. When the platform holds no record for an instrument, the run uses a tick of 0.05 and a lot of 1 and the line says so, because a guessed tick size makes every slippage charge wrong without anything else looking wrong. Money is shown in rupees, to two decimal places, and each charge is rounded to the paisa.
What runs where
| Where | What it does | Where orders go |
|---|---|---|
| Backtest panel | Runs the strategy over the chart's history, in your browser, on a background thread where the browser allows one, so the chart keeps drawing | A fill model over the bars. Nothing is sent to a broker |
| The chart | Draws the strategy's plots when it is applied or added from the indicators list, run against the same simulated fills the backtest uses, over the bars the chart has loaded | Nowhere: the chart draws and does not trade |
| Strategies panel | Runs a deployment as a process on the server, bar by bar as bars close | The platform's own order path: the sandbox in analyzer mode, your broker in live mode |
All three run the same compiled program, so the values a script computes from the same bars agree between them. What differs is where the orders go and, in release 0.5.0, which parts of a script each place supports. Sandbox and live covers the third row and lists what the server runner needs.
Warmup: how much history the first trade needs
A function that needs k bars returns the absent value until k bars exist, and absence carries through arithmetic, through comparisons and into the branch that would have placed the order. An absent condition takes the false branch, so during warmup no order is placed. That protects you automatically. What it does not do is tell you when warmup ended, and you need that number to choose a range. Warmup covers the rule in full.
Warmups add up along a chain. sma(ema(close, 10), 10) has no value until bar 18: the inner average is absent until bar 9, and the outer one needs ten present values after that.
Take the entry condition apart, write down each term's warmup, and take the largest:
| Term in the entry | First bar with a value |
|---|---|
ema(close, 200) | bar 199 |
atr(14) | bar 13 |
rsi(close, 14) | bar 14 |
highest(high, 20)[1] | bar 20 |
The signal line of macd(close, 12, 26, 9) | bar 33 |
There are three kinds of warmup, and the reference gives only the first: each call's own length, the extra bars a [n] lookback adds, and state your file builds up in a var over time. The third is the one that gets missed, because it is in your file and nowhere else.
A file whose entry reads ema(close, 200) is warm at bar 199. On a 15 minute chart that is eight sessions in. A useful default: take the file's warmup in bars, add a fifth for the lookbacks you forgot, and round up to a whole session.
Two ways to make the first trade honest
The Backtest panel trades every bar in the range, so the warmup bars are inside it. The first way is to reach back further than you want to trade and keep the strategy out of the market until your own window starts. Two time inputs make the window a setting:
version 1

strategy("Traded window", overlay = true, precision = 2,
         capital = 500000, qty = 1)

// Dates, not times of day: the Backtest panel gives the run no time zone, so a
// written time of day would be read as UTC rather than as Indian time.
tradeFrom = input("2025-01-01", "Trade from",      kind = "time")
tradeTo   = input("2026-01-01", "Stop trading on", kind = "time")

fast = ema(close, 20)
slow = ema(close, 200)
goLong = crossUp(fast, slow)
goFlat = crossDown(fast, slow)

// Bars before tradeFrom are loaded and computed, they are simply not traded.
// With From set far enough back, the 200 bar average is already warm on the
// first bar inside the window, which makes its first trade comparable with its
// last.
inWindow = time >= tradeFrom and time < tradeTo

if inWindow and goLong and pos.isFlat
    buy()

if pos.isLong and (goFlat or not inWindow)
    close()

plot(slow, "Slow", orange, width = 2)
background(inWindow ? none : fade(silver, 92))
Set From a few weeks before Trade from and To on or after Stop trading on, and the grey background shows the bars that were computed and not traded. Time inputs are for backtesting only: the strategy runner refuses to start a script that declares one, so take the window out before you deploy.
The second way is to state the guard in the script, which is worth doing anyway because the chart then shows the bar the strategy became honest on rather than leaving you to infer it from the first marker:
version 1

strategy("Guarded entry", overlay = true, precision = 2,
         capital = 500000, qty = 1)

trend    = ema(close, 200)
breakout = highest(high, 20)[1]
strength = rsi(close, 14)

// Every value the entry reads, tested once. Absence would already have skipped
// the entry, because an absent condition takes the false branch. The guard
// exists so the chart can show where the strategy became warm.
warm = not isNone(trend) and not isNone(breakout) and not isNone(strength)

if warm and pos.isFlat and close > breakout and strength > 55 and close > trend
    buy()

if pos.isLong and close < trend
    close()

plot(trend, "Trend", aqua, width = 2)
plot(breakout, "Breakout level", orange, style = "step")
background(warm ? none : fade(silver, 92))
What the 0.5.0 backtest does not model yet
Some parts of a strategy compile and are not acted on by the backtest in this release. Most of them fail quietly, with a report that looks normal, so know them before you read one. Two are refused before the run starts, with the reason shown in the panel:
| In the script | In a 0.5.0 backtest | What to do |
|---|---|---|
A stop or target set with exit() or order.bracket() | Not filled | Write the stop as a rule tested on each close. Costs and fills shows one |
closeOnSessionEnd = true | Not acted on: a position is carried past the close | Close it in the script as well |
A calendar read with no time zone, such as date.hour(time) or session.isIn("0915-1530") | Absent on every bar, because the panel does not state the chart's time zone to the run, so a condition built on it is never true | Pass the zone: date.hour(time, "Asia/Kolkata"), session.isIn("0915-1530", "Asia/Kolkata") |
session.isFirstBar, session.isLastBar | No value, so never true: the run is given no session boundaries | Anchor on a time window you write with an explicit zone |
A day, week or month read, such as req.timeframe("1D", close) | Absent on every bar, because the run has no time zone to group days in | Filter on an intraday read such as "1h", or test the strategy drawn on the chart |
chart.interval, chart.intervalMinutes, chart.isIntraday | Absent: the panel does not state the chart's interval to the run | Take a length in bars as an input |
Another instrument, read with req.symbol() | The run is refused before it starts | Backtest on the instrument itself; an intraday req.timeframe() read of the chart's own instrument works |
qtyType = "lots" | Entries are converted from lots to units, but an exit that sizes itself, such as close(), is not: it sends the position's unit count as a number of lots, sells many times what is held and opens a large position the other way | Use qtyType = "units" |
qtyType = "cash" or "equityPercent" | The run is refused before it starts | Use qtyType = "units" |
One more behaviour is worth knowing. An order the strategy is not allowed to place, such as a second entry while one is open and pyramiding is 1, is an error that stops the script at that bar (OS7008). Nothing after that bar is placed or filled: the trade list ends there, and the equity curve carries whatever position was open, marked to every later close, to the end of the range. The Backtest panel does not show the error, so a run that shows far fewer trades than the chart suggests, or ends on one long open trade, is worth checking for this first. Guarding every entry with pos.isFlat, or with the side you mean to add to, keeps a strategy from reaching one. Orders lists the refusals.
Reproducing a run
The panel keeps the latest run on screen and stores nothing. To reproduce a result later you need what it was a run of:
| Fact | Why it changes the answer |
|---|---|
| The script, as saved | The exact rules that ran |
| Symbol and exchange | Which prices |
| Interval | The resolution of every decision |
| From and To | Which bars |
| Every input you changed | The parameters the rules ran with |
| Tick size and lot size, from the line under the figures | Every money figure |
Restore those, run again, and compare the trade list rather than the summary. Two runs with the same net profit and different trade lists are not the same run.
The language makes a rerun a check rather than a new experiment. It has no random number function, and the same compiled program over the same bars, with the same inputs and the same instrument facts, produces the same numbers every time. If two runs that match on every row of the table above disagree, the bars changed: an adjusted history or a revised bar moves a result, and none of it is in the script.
What a run cannot tell you
A run tells you what a fixed set of rules did over a fixed set of bars. It cannot tell you whether the rules will keep working, whether you chose them because they fitted those bars, or whether you would have held the position through the drawdown in the middle. Reading the report well is a separate skill, and it is the next page.
Mistakes that produce a beautiful, wrong result
| Mistake | What it looks like | Fix |
|---|---|---|
| Trading from the first bar of the range | The first trades fire on half-warm values | Load warmup bars before the traded window |
fillOn = "close" | Every entry at the price that triggered it | Leave the default |
| Zero costs | A dense intraday script prints money | Set slippage and commission before reading anything |
A stop set with exit() | Losses run far past the stop level the script set | Write the stop as a rule in 0.5.0 |
| One regime | A long-only strategy over a rising market | Extend or move the range |
| Tuned on the whole range | Every parameter at a local peak | Hold a section back before tuning |
| Too few trades | A 22 trade run with a 68 percent win rate | Longer range, finer interval, or drop the idea |
Related. Costs and fills, Reading a report, Reading the books, Sandbox and live, Warmup, Your first strategy