
chart.*
The chart namespace, facts about the instrument and the chart it is drawn on, symbol, exchange, instrument type, tick size, lot size, point value, interval, timezone and the wall clock.
On this page
The chart namespace answers questions about what the script is running on: which instrument, on which exchange, at what interval, in which timezone, and with what contract arithmetic (tick size, lot size, point value). A script that reads these facts instead of typing numbers in can work unchanged on an NSE stock, an NFO index future and an MCX contract, wherever the host states them.
Not every host states every fact. The /trading chart in this release passes the script only the symbol, the interval, the tick size and the timezone, so chart.exchange, chart.lotSize, chart.instrumentType, chart.hasVolume and the rest read as none there. The table under Where the facts come from shows what each part of /trading states, and each entry below says what to do where its fact is missing.
Every entry except chart.now() is a single value, fixed for the whole run. None of them has a history, so chart.tickSize[1] is OS2004: the answer could not have been different one bar ago.
Where the facts come from
Every fact here comes from the host, the application that runs the script, and any of them may be missing. A fact the host does not state reads as none, never as a guess, so a script can tell "one lot is 75 units" from "nobody said".
In this release the /trading page states these facts:
| Fact | On the /trading chart | In the /trading Backtest panel |
|---|---|---|
chart.symbol | Yes | Yes |
chart.exchange | none | Yes |
chart.interval, and chart.intervalMinutes and chart.isIntraday worked out from it | Yes | none |
chart.timezone | Yes, "Asia/Kolkata" unless the chart is set otherwise | none |
chart.tickSize | Yes | Yes |
chart.lotSize, chart.pointValue, chart.currency | none | Yes |
chart.instrumentType, chart.hasVolume, chart.hasOpenInterest | none | none |
chart.now() | Yes | none |
So test a fact with isNone(), or give it a fallback with orElse(), before a calculation depends on it. The example below shows each fact, or "not stated" where the host gave none.
version 1
study("Instrument facts", overlay = true)

fn shown(s: string) => isNone(s) ? "not stated" : s
fn shownNumber(x: number) => isNone(x) ? "not stated" : text(x)
fn yesNo(b: bool) => isNone(b) ? "not stated" : b ? "yes" : "no"

panel = table("Instrument", 7, 2, position = "topRight")

if bar.isLast
    cell(panel, 0, 0, "Symbol")
    cell(panel, 0, 1, shown(chart.symbol))
    cell(panel, 1, 0, "Exchange")
    cell(panel, 1, 1, shown(chart.exchange))
    cell(panel, 2, 0, "Type")
    cell(panel, 2, 1, shown(chart.instrumentType))
    cell(panel, 3, 0, "Interval")
    cell(panel, 3, 1, shown(chart.interval))
    cell(panel, 4, 0, "Tick size")
    cell(panel, 4, 1, shownNumber(chart.tickSize))
    cell(panel, 5, 0, "Lot size")
    cell(panel, 5, 1, shownNumber(chart.lotSize))
    cell(panel, 6, 0, "Volume supplied")
    cell(panel, 6, 1, yesNo(chart.hasVolume))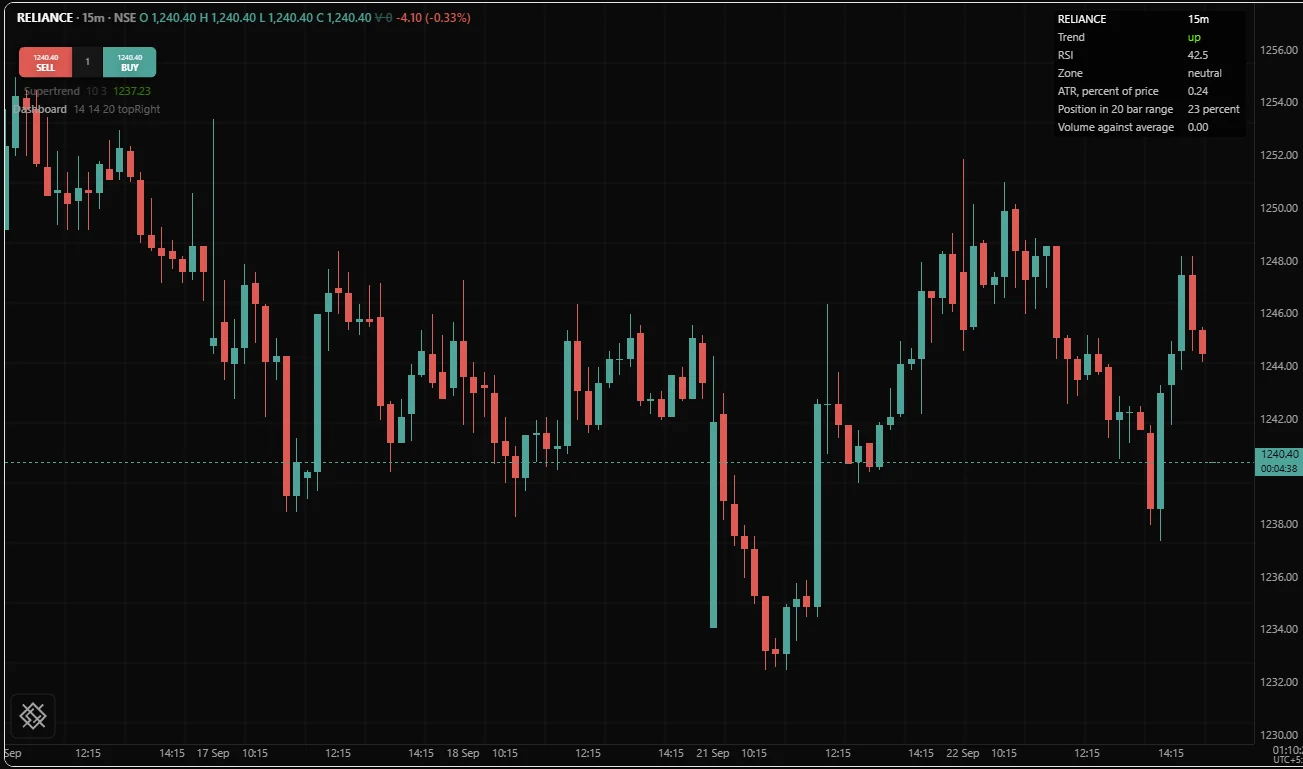
The instrument
chart.symbol
The instrument's symbol as the host names it, such as "RELIANCE" or "SBIN" for NSE equities. It is none when the host names none. Use it in labels and tables, or to adapt a script to one instrument.
chart.symbol: string- Type
string- First value
- n/a
version 1
study("Symbol label", overlay = true)

if bar.isLast
    draw.label(time, high, chart.symbol + " " + text(close, 2), textColor = white)
See also. chart.exchange, req.symbol()
chart.exchange
The exchange the instrument trades on, as the host codes it: for example "NSE" or "BSE" for cash equities, "NFO" for NSE futures and options, "MCX" for commodities, or none where the host does not say, as on the /trading chart. It is also the default exchange of req.symbol(), so a read of another instrument looks on the same exchange unless you name one.
chart.exchange: string- Type
string- First value
- n/a
version 1
study("Exchange tag", overlay = true)

isDerivative = chart.exchange == "NFO" or chart.exchange == "MCX"
background(isDerivative ? fade(purple, 95) : none)
Remarks. The /trading chart does not state the exchange in this release, so there the value is none and both comparisons above are false: == never returns none, which keeps the example safe to run anywhere.
See also. chart.symbol, chart.instrumentType
chart.instrumentType
What kind of instrument the chart shows. It is one of seven strings: "equity", "future", "option", "index", "currency", "commodity" or "other", or none when the host does not say. Branch on it when a study should behave differently on, say, an index and its future.
chart.instrumentType: string- Type
string- First value
- n/a
version 1
study("Index or not", overlay = true)

isIndex = chart.instrumentType == "index"
// Weight the average by volume except on an index, which has none to weight by.
weighted = vwma(close, 20)
plain = sma(close, 20)
plot(isIndex ? plain : weighted, "Mean of 20 bars", isIndex ? orange : aqua)
Remarks. Pair this check with chart.hasVolume and chart.hasOpenInterest rather than assuming what each type supplies. The /trading page does not state the instrument type in this release.
See also. chart.hasVolume, chart.optionType
chart.currency
The currency label the host uses for money on this instrument, such as "INR". It is a label for reports and tables; it changes no number.
chart.currency: string- Type
string- First value
- n/a
version 1
study("Value of one lot", overlay = true)

panel = table("Contract", 1, 2, position = "bottomRight")
lotValue = close * chart.lotSize
if bar.isLast
    cell(panel, 0, 0, "One lot, in " + orElse(chart.currency, "the instrument's money"))
    cell(panel, 0, 1, isNone(lotValue) ? "lot size not stated" : text(lotValue, 0))
See also. chart.pointValue, chart.lotSize
Contract arithmetic
chart.tickSize
The instrument's smallest price step, such as 0.05 for many NSE contracts. It is none when the host has not said, rather than a guessed small number, so a script sizing a stop in ticks can tell "one tick is 0.05" from "nobody said".
chart.tickSize: number- Type
number- First value
- n/a
version 1
study("Stop twenty ticks below the low", overlay = true)

ticks = input(20, "Stop distance in ticks", min = 1)
stopLevel = low - orElse(chart.tickSize, 0.05) * ticks
plot(roundToTick(stopLevel), "Stop", red, style = "step")
Remarks. Anything derived from an absent tick size is absent too, which is why roundToTick() returns none in that state instead of an unrounded price that looks rounded. The example supplies a fallback with orElse() for the distance, and the plot is still absent if the host gives no tick size at all. Both the /trading chart and its Backtest panel state the tick size.
See also. roundToTick(), roundToStep()
chart.lotSize
How many units make up one lot. On NFO futures and options and on MCX, orders are placed in whole lots, and lot sizes are set by the exchange and revised from time to time, so read this value rather than typing a number into a script. It is none when the host has not said, which on /trading means on the chart: only the Backtest panel states it.
chart.lotSize: number- Type
number- First value
- n/a
version 1
study("Exposure of one lot", precision = 0)

lotValue = close * chart.lotSize
plot(lotValue, "Value of one lot", aqua)
Remarks. The /trading Backtest panel states the lot size, from the platform's instrument record. The /trading chart does not in this release, so there the example draws nothing, which is the honest answer: without a lot size there is no lot value. A strategy that sizes in lots can declare qtyType = "lots", and then every order quantity is a count of lots of this size. See Declarations.
See also. order.roundToLot(), chart.pointValue
chart.pointValue
The money one point of price is worth for one unit of the instrument. For a cash equity it is normally 1: a one-rupee move is one rupee per share. It is none when the host does not know it. Multiply by the lot size to get the value of a point for a whole lot.
chart.pointValue: number- Type
number- First value
- n/a
version 1
study("Rupees per point, per lot", precision = 0)

perLot = chart.pointValue * orElse(chart.lotSize, 1)
atrMoney = atr(14) * perLot
plot(atrMoney, "Average true range in money, per lot", orange)
Remarks. The /trading Backtest panel states a point value of 1. The /trading chart does not state one in this release, so there the example draws nothing.
See also. chart.lotSize, chart.currency, atr()
What the host supplies
chart.hasVolume
True when the host states that it supplies volume for this instrument, false when it states that it does not, and none when it says neither. Where it is false, volume is absent on every bar. Test this once instead of testing the value on every bar.
chart.hasVolume: bool- Type
bool- First value
- n/a
version 1
study("Volume if available", format = "volume")

// Hide the column only when the host says there is no volume.
showVolume = chart.hasVolume != false
plot(showVolume ? volume : none, "Volume", fade(aqua, 40), style = "column")
Remarks. The /trading page does not state this fact in this release, so it is none there. chart.hasVolume ? volume : none would then hide the volume that is actually present; chart.hasVolume != false does not, because none != false is true.
See also. volume, chart.hasOpenInterest
chart.hasOpenInterest
True when the host states that it supplies open interest for this instrument, as it can for futures and options, false when it states that it does not, and none when it says neither. Where it is false, oi is absent.
chart.hasOpenInterest: bool- Type
bool- First value
- n/a
version 1
study("Open interest if available", format = "volume")

showOi = chart.hasOpenInterest != false
plot(showOi ? oi : none, "Open interest", purple)
See also. oi, chart.hasVolume
The chart's interval and clock
chart.interval
The chart's interval as the host names it: a count and a unit such as "1m", "5m" or "1h", a bare number of minutes such as "60", or a letter such as "D", "W" or "M", which is how the /trading chart names its daily, weekly and monthly intervals. The unit letter is case sensitive: "1M" is a month and "1m" is a minute.
chart.interval: string- Type
string- First value
- n/a
version 1
study("Interval stamp", overlay = true)

if bar.isLast
    draw.label(time, high, chart.symbol + ", " + chart.interval, textColor = silver)
See also. chart.intervalMinutes, req.timeframe()
chart.intervalMinutes
The chart's interval in minutes: 5 on "5m", 60 on "1h" or "60", 1440 on "1D". It is none for an interval with no fixed length in minutes, such as a month, and none for an interval named with a bare letter, such as "D". Use it to turn a duration into a count of bars.
chart.intervalMinutes: number- Type
number- First value
- n/a
version 1
study("One hour of bars", overlay = true)

barsPerHour = chart.isIntraday ? max(1, round(60 / chart.intervalMinutes)) : 1
plot(sma(close, barsPerHour), "Mean of the last hour", aqua)
Remarks. A count derived this way assumes no bars are missing. Inside a session that holds; across a session break or a holiday it does not, so measure elapsed time with time where that matters.
See also. chart.isIntraday, chart.interval
chart.isIntraday
True when the chart's interval is shorter than one day, and false for a day or longer. Like chart.intervalMinutes, it is none when the interval is not stated or is named with a bare letter such as "D", and a condition that is none takes the false branch. Session tools such as an opening range only make sense on an intraday chart, so this is the natural guard for them.
chart.isIntraday: bool- Type
bool- First value
- n/a
version 1
study("Daily VWAP on intraday charts", overlay = true)

newDay = bar.isFirst or not date.isSameDay(time, time[1])
dayVwap = vwapAnchor(hlc3, newDay)
plot(chart.isIntraday ? dayVwap : none, "VWAP from the day's first bar", orange)
See also. chart.intervalMinutes, vwapAnchor()
chart.timezone
The timezone the chart's time axis is labelled in, as an IANA name (the standard Area/City form) such as "Asia/Kolkata" for Indian exchanges. Every date function and session.isIn() reads time in this zone unless you pass another, so calendar fields agree with the axis you are looking at.
chart.timezone: string- Type
string- First value
- n/a
version 1
study("Zone check", overlay = true)

panel = table("Clock", 2, 2, position = "bottomRight")
if bar.isLast
    cell(panel, 0, 0, "Chart zone")
    cell(panel, 0, 1, orElse(chart.timezone, "not stated"))
    cell(panel, 1, 0, "Newest bar opened")
    cell(panel, 1, 1, date.format(time, "dd MMM HH:mm"))
Remarks. The /trading Backtest panel states no timezone in this release. There a date or session call that relies on the default returns none; pass the zone explicitly, as in date.hour(time, "Asia/Kolkata"), in a strategy you backtest.
See also. date.hour(), session.isIn()
chart.now()
The chart's wall clock, as UTC milliseconds. It is the only clock a script can read while a bar runs; everything else is a function of the bars. Use it to ask how old the newest bar is, not to compute anything on history.
chart.now() -> number- Returns
number- First value
- n/a
version 1
study("Bar age", precision = 0)

ageMinutes = (chart.now() - time) / 60000
plot(bar.isLast ? ageMinutes : none, "Minutes since the newest bar opened", silver)
Remarks. It is a call rather than a value because it is the one thing in the language that is not fixed for the run. The host decides what it returns, so a test can fix it and a script that uses it can still be reproduced. A backtest has no wall clock: in the /trading Backtest panel it is none.
See also. time, bar.isRealtime
Planned
These facts are named in the language and not available in this release; using one is OS2020. Each will read from the instrument the host supplies.
chart.expiry
The expiry instant of a futures or options contract, in UTC milliseconds, so a script can count the days or bars left before expiry.
Named in the language and not available in version 0.5.0. Calling it is error OS2020.
chart.expiry: number- Type
number- First value
- n/a
chart.strike
The strike price of an options contract, for studies that compare an option's premium with how far the underlying is from its strike.
Named in the language and not available in version 0.5.0. Calling it is error OS2020.
chart.strike: number- Type
number- First value
- n/a
chart.optionType
Whether an options contract is a call or a put: "call", "put", or "" for an instrument that is not an option or where the host has not said.
Named in the language and not available in version 0.5.0. Calling it is error OS2020.
chart.optionType: string- Type
string- First value
- n/a
chart.isReplay
True when the chart's bars are being replayed one at a time rather than loaded whole, so a script can tell a replay from a history load.
Named in the language and not available in version 0.5.0. Calling it is error OS2020.
chart.isReplay: bool- Type
bool- First value
- n/a
Related
Price and volume, session.*, date.*, Other instruments, Timeframes, Position and sizing.