
Introduction
OpenScript, also called OpenAlgo Script, is one open language for studies and strategies. It compiles to data rather than code, runs in the /trading page of OpenAlgo, and ships as two Apache 2.0 libraries anyone can build on.
On this page
OpenScript is a language for writing what you want to see on a chart and what you want to trade when you see it. It is also called OpenAlgo Script, and it is the scripting language of the /trading page in OpenAlgo. This page covers what the language is, the two kinds of script you can write, where they run, why a script compiles to data instead of code, and the two open libraries that let any financial portal run the same scripts. Read it first: every other page assumes the ideas here.
New to OpenScript? Start with Language basics, the whole language on one page.
A first look
A file written in OpenScript is a script. Here is a complete one, a study: a script that computes values and draws them, and never trades. It draws Supertrend, a trailing band built from the average true range (how far price typically moves in one bar). The band sits under price in green while the trend is up and above it in red while it is down, the side it protects is shaded, every flip is labelled, and an alert is raised when the direction changes. It works on any instrument: an NSE or BSE stock, a NIFTY future on NFO, or a crude oil contract on MCX.
// Supertrend: a band that trails price by a multiple of the average true
// range, green under price in an uptrend and red above it in a downtrend.
version 1

study("Supertrend", overlay = true, precision = 2)

atrLen = input(10, "ATR length", min = 1, max = 200)
factor = input(3.0, "Factor", min = 0.01, max = 20)

st = supertrend(factor, atrLen)
band = st[0]
isLong = st[1] < 0

// Two plots, so the line can change colour when the trend flips.
middle = plot((open + close) / 2, "Body middle", fade(silver, 100))
upLine = plot(isLong ? band : none, "Up trend", lime, width = 2)
downLine = plot(isLong ? none : band, "Down trend", red, width = 2)
fill(upLine, middle, fade(lime, 90))
fill(downLine, middle, fade(red, 90))

turnedUp = isLong and not isLong[1]
turnedDown = not isLong and isLong[1]

if turnedUp
    signal("BUY", lime, at = "below", shape = "label")

if turnedDown
    signal("SELL", red, at = "above", shape = "label")

if turnedUp or turnedDown
    alert("Supertrend changed direction at " + text(close, 2), id = "supertrend-change")
Read it from the top:
- A line that starts with
//is a comment, which the compiler ignores. version 1fixes the language version the file is written in, so it keeps meaning the same thing under every later release.study(...)names the script and, withoverlay = true, puts it on the price pane.input()turns a value into a setting you can change from the chart without editing the file.supertrend()comes from the standard library, with no prefix and no import. It returns two values in an array:st[0]is the band andst[1]is the direction, which is negative while the trend is up.- Two
plot()calls draw the band, one while the trend is up and one while it is down, because a single plot keeps one colour.noneleaves a plot empty on a bar. A fully transparent plot of the middle of each candle body givesfill()something to shade the band against. isLong[1]is the direction one bar earlier, soturnedUpandturnedDownare true only on the bar where the trend flips.signal()draws the BUY and SELL labels on those bars, andalert()raises an alert with the price. Alerts from scripts explains when a script's alert fires.
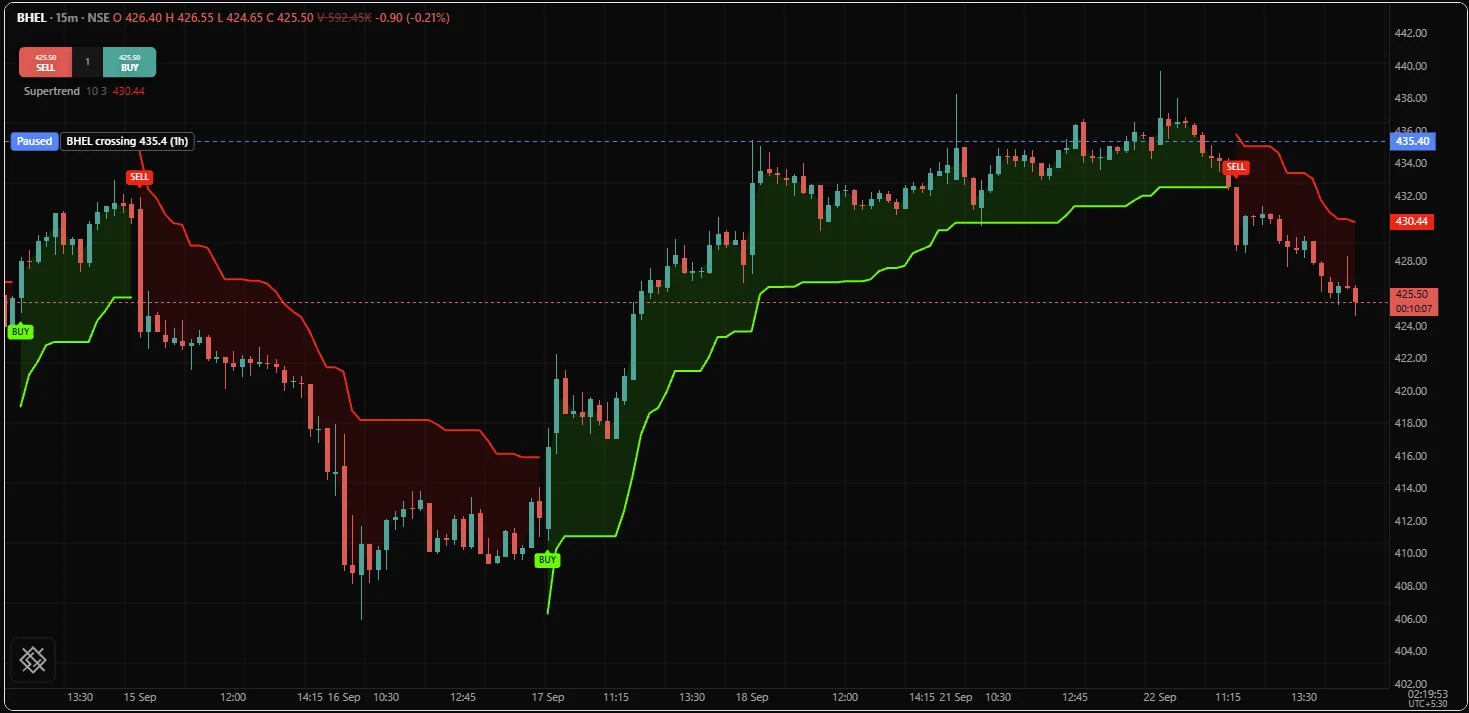
This is that study on a BHEL 15 minute chart, with the band trailing price, the protected side shaded and every flip labelled:
The same idea becomes a strategy, a script that also places orders, when you change the declaration and add them. Here is a shorter version that trades the flips:
version 1

strategy("Supertrend, traded", overlay = true, qty = 1)

atrLen = input(10, "ATR length", min = 1, max = 200)
factor = input(3.0, "Factor", min = 0.01, max = 20)

st = supertrend(factor, atrLen)
band = st[0]
isLong = st[1] < 0

plot(isLong ? band : none, "Up trend", lime, width = 2)
plot(isLong ? none : band, "Down trend", red, width = 2)

if isLong and not isLong[1] and pos.isFlat
    buy()

if not isLong and isLong[1] and pos.isLong
    close()
buy() opens a long position and close() flattens it. pos.isFlat and pos.isLong read the position the strategy holds, so it buys only when it holds nothing and closes only when it is long. The band on the chart and the band the strategy trades on are written once, in the same lines of the same file. They cannot drift apart, because there is only one definition of them.
One idea behind the whole language
A script runs once per bar, from the first line to the last, oldest bar first. There is no main function and no event handler: the file itself is the body of a loop the engine runs over every bar on the chart. close is the closing price of the bar being computed, close[1] is the one before it, and a value that cannot exist yet (a 20 bar average on bar 5) is absent rather than zero. The execution model page explains this in full, and it explains most of the language.
Studies and strategies
A study and a strategy are the same language and the same file format. The only difference is the declaration on the first statement, and what that declaration allows.
| Study | Strategy | |
|---|---|---|
| Declared with | study("Name", ...) | strategy("Name", ...) |
| Computes and draws | Yes | Yes |
Places orders with buy(), sell() and close() | No, that is OS7001 | Yes |
Reads its own position with pos.* | No | Yes |
| On the /trading chart | Added from the Scripts panel or the Indicators dialog | The same, with its trades simulated in the browser |
| Backtest | Not applicable: a study has no trades | The Backtest panel, in the browser |
| Runs on the server and sends orders | No | Deployed from the Strategies panel |
Start with a study. When the chart shows what you expect, change the declaration and add orders. Your first strategy walks through exactly that.
Where it runs: the /trading page
Everything happens in the /trading page of OpenAlgo. The right-hand toolbar holds eight panels: Watchlist, Option chain, Objects, Alerts, Scripts, Backtest, Strategies and Assistant. Three of them are for OpenScript.
| Panel | What you do there |
|---|---|
| Scripts | Write, check and save scripts, and apply one to the chart |
| Backtest | Run a saved strategy over the history of the instrument on the chart, in your browser |
| Strategies | Deploy a strategy on an instrument so the OpenAlgo server runs it and sends its orders |
A saved script also appears in the chart's Indicators dialog under My scripts, beside the built-in indicators, and every input() it declares becomes a field in its settings dialog.
The Strategies panel sends orders through OpenAlgo's own order path, so a deployed strategy trades the way every other part of OpenAlgo does: against the sandbox while OpenAlgo is in analyzer mode, and with your broker while it is in live mode. Test in sandbox trading (analyzer mode in OpenAlgo) first. The Sandbox and live page covers the details.
The Quickstart takes you from an empty panel to a study on an NSE chart in about five minutes.
Why it compiles to data, not code
The compiler does not turn your script into JavaScript or Python. It turns it into a compiled program: a flat list of instructions plus a few tables of constants, inputs and outputs, in a documented and versioned format. An engine, the part that executes compiled programs, runs a script by walking that list, bar by bar.
That one decision has practical consequences you benefit from even if you never think about it.
- Nothing is ever executed as code. No part of the system evaluates text. The compiler and engine run inside the /trading page under the strict content security policy OpenAlgo already sets, with no exception made for scripts.
- A script cannot reach anything. A script can only name what the instruction set offers. There is no way to write a network call, open a file or touch the page around it, so a study shared by a stranger can draw a wrong line but cannot place an order or read your account.
- A runaway script stops. The engine owns the loop, so it counts instructions, memory and time on every bar and stops a script that exceeds its budget. One failing script does not take anything else down.
- The browser and the server agree. When you save a script that compiles, OpenAlgo stores its compiled program beside the source, stamped with a fingerprint (a hash) of the exact text it came from. The chart and the Backtest panel compile that saved text in your browser; a strategy deployed from the Strategies panel runs the stored program on the server, in a separate process, with the Python engine. One compiler and one text give one program, and the fingerprint lets the server refuse a program that does not match its source.
The Compiled program page describes the format for anyone who wants to read it.
Two libraries for your own portal
OpenScript is an open project, not a feature locked inside one product. The language ships as two libraries that anyone can build into their own financial portal, trading terminal or research tool, commercial or not. Both are licensed under Apache 2.0, both have zero runtime dependencies, and both are at version 0.5.0.
| Library | Install | Language | What it gives you |
|---|---|---|---|
openalgo-script | npm | JavaScript and TypeScript | The compiler and the engine; six headless editor functions, meaning functions with no screen of their own that an editor calls (highlight, complete, diagnose, hover, signature and format); an adapter that draws a compiled study on openalgo-charts; the backtest |
openscript | PyPI | Python 3.12 or newer | An engine that runs compiled programs on a server, with no compiler in it |
npm install openalgo-script
pip install openscript
The /trading page itself is built this way: the Scripts panel, the chart and the Backtest panel use openalgo-script in the browser, and the Strategies panel runs deployed strategies with openscript on the server. A platform with its own chart or its own editor replaces the adapter for that piece and keeps the rest. The Two libraries page explains the pieces and how to adopt them one at a time.
What version 0.5.0 does, and what is planned
The language is young, and these pages say plainly what works today.
- Works now. Studies with plots, fills, levels, markers, bar colours, backgrounds, drawing objects, tables and alerts. Reading another timeframe or another instrument on the chart. Strategies with market, limit and stop orders, backtested in the browser with commission and slippage, simulated on the chart, and deployed from the Strategies panel.
- Planned. Some names in the library are declared but not implemented yet, for example the risk-based sizing helpers such as
order.qtyForRisk()and the account figures such aspos.equity. The compiler refuses a planned name where you wrote it, with OS2020 and a message that says it is planned, rather than letting the script fail later. The reference marks every planned entry. - Not modelled yet. A stop and target attached with
exit()are not filled by the 0.5.0 backtest, and a strategy that callsexit()is refused by the Strategies panel. Manage exits in the script withclose()for now, as Your first strategy shows.
What the /trading page does not supply yet
A script can ask for facts about the market that the /trading page does not pass to the engine in this release. Where a fact is missing, the value that reads it has no value on any bar, and a condition built on it is never true. The script still compiles, so it is worth knowing before you wonder why a study drew nothing.
| Fact or feature | On the chart | Backtest panel | Strategies panel |
|---|---|---|---|
Session hours, read by session.isFirstBar and the other session.* values | No value | No value | Refused |
Lot size, read by chart.lotSize | No value | Stated | Stated |
Another timeframe, read with req.timeframe() | Works | No value, because the panel does not state the chart's interval | Refused |
Another instrument, read with req.symbol() | Works | Refused with OS6006 | Refused |
| Drawing objects and tables | Work | Run, but a backtest shows only trades | Refused |
The Strategies panel also refuses a strategy that reads the calendar (the date.* functions) or sizes its orders in anything but units, and every refusal names its reason. Example scripts shows what these limits mean for twelve complete scripts.
The Release notes list every change and what is still to come.
How these pages are organised
| Section | Read it for |
|---|---|
| Getting started | A first study, a first strategy, the editor and twelve complete examples |
| Language | How a script is built and how it runs, bar by bar |
| Data and time | Timeframes, other instruments, the NSE session and repainting |
| Visuals | Everything a script can draw |
| Inputs and settings | Making a script adjustable from the chart |
| Alerts | Raising alerts from a script and managing them in /trading |
| Strategies | Orders, exits, sizing, costs, backtesting and deployment |
| Writing scripts | Style, debugging, limits and troubleshooting |
| Reference | Every keyword, operator and library name, generated from the compiler |
| Errors | Every diagnostic code, with its cause and fix |
| Integrate | Building OpenScript into your own portal |
Every code block on these pages is checked with the real compiler before the documentation is published, so an example you copy is an example that compiles.
Related. Quickstart, Your first strategy, The editor, Example scripts, Execution model, Two libraries, Glossary