
OS8xxx Warnings
The warnings the compiler gives about code that runs but is probably not what you meant: stateful calls in branches, repainting reads, alerts without ids, unused names and dead code.
On this page
This page covers the OS8xxx codes of OpenScript (also called OpenAlgo Script): the warnings. A warning never stops anything. The script compiles, runs and draws exactly as written. What a warning says is that a line has a shape whose behaviour is well defined and almost never what its author wanted: an average that only advances on some bars, a study that shows values it could not have known, an alert that will stop firing when you edit the file. Reading each one takes a moment, and ignoring one is how a chart ends up quietly wrong.
Where they appear
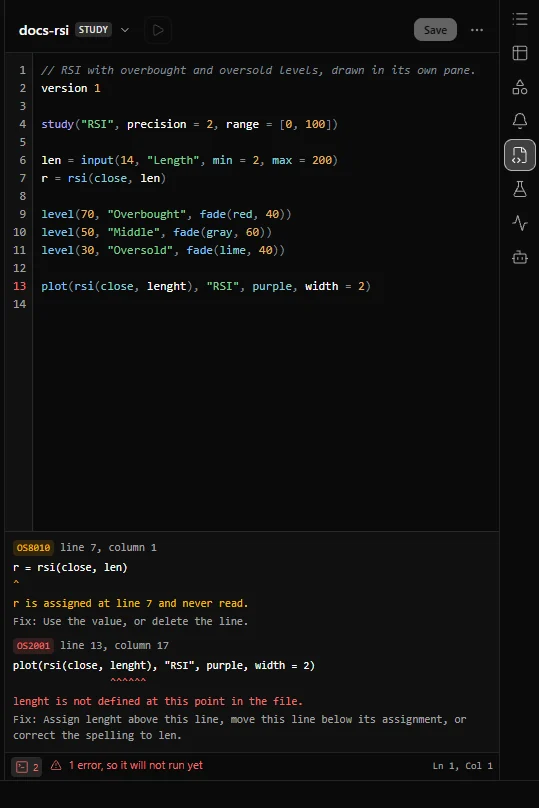
Warnings come from the compiler, so you see them when you save a script in the Scripts panel, before anything runs. Each one is listed in the console under the editor with its line, its message and its fix, and the status bar reads "Ready, with 1 warning" instead of "Ready". A script with warnings can still be applied to a chart, backtested and deployed. See The editor.
Five of the nineteen codes are reserved for checks the compiler does not make yet: OS8004, OS8006, OS8013, OS8014 and OS8019. Their entries say so, and describe the shape to avoid by hand until the warning arrives.
A script with nothing to warn about
This EMA cross study is written the way the warnings below ask for: the stateful calls run on every bar, the version line is there, every input is read, and the alert has a fixed id.
version 1
study("Clean EMA cross", overlay = true)

fastLen = input(9, "Fast length", min = 1, max = 200)
slowLen = input(21, "Slow length", min = 1, max = 400)

// Stateful calls at the top level, so they advance on every bar (OS8001).
fast = ema(close, fastLen)
slow = ema(close, slowLen)
crossed = crossUp(fast, slow)
trending = fast > slow

// Hide a value with none instead of computing it inside a branch.
plot(trending ? fast : none, "Fast EMA in an uptrend", aqua)
plot(slow, "Slow EMA", orange)

// A fixed id keeps an alert subscription attached when lines move (OS8008).
if crossed
    alert("Fast EMA crossed above the slow EMA", id = "emaCrossUp")
The file
OS8003 No version declaration
What it means
The first line of a script, version 1, names the language version it is written in. A file that names its version is read by that version's rules for ever, even after newer versions ship. A file without one is read by the newest version the compiler has, which is the one thing that can change under it. In this release the file still compiles and runs, as version 1.
Add version 1 as the first line. Every complete example in this documentation starts with it. See Script structure.
How to fix it
Add version version as the first line of the file.
Before
study("EMA cross")After
version 1

study("EMA cross")
OS8013 Deprecated
What it means
When a function or an option turns out to be a mistake, it is never removed and never changes meaning, because a saved script must keep producing the same numbers. It is marked deprecated instead, and this warning names its replacement, which computes the same values.
Not raised yet. In version 0.5.0 no name in the library is deprecated, so this warning never appears. The example below uses placeholder names to show its shape.
How to fix it
Replace name with replacement; the two compute the same values.
Before
plot(oldName(close, 14), "Value", aqua)After
plot(newName(close, 14), "Value", aqua)Where a call runs
OS8001 A stateful call inside a branch
What it means
Stateful calls, such as ema(), sma(), rma(), crossUp() and any user function that keeps a var, carry state from one bar to the next. When such a call sits inside an if branch, or in one arm of a ternary, it runs only on the bars where that branch runs: its state advances only on those bars, and it is absent on the rest. An EMA computed only on trending bars is not the chart's EMA; it is an average of whichever bars happened to trend.
Compute the call unconditionally at the top level, give it a name, and use the name inside the branch, as the example at the top of this page does. See Execution model and User functions.
How to fix it
Compute it unconditionally at the top level and use the result inside the branch.
Before
if trending
    e = ema(close, 20)
    plot(e, "EMA", aqua)
After
e = ema(close, 20)
plot(trending ? e : none, "EMA", aqua)
OS8004 A branch on an absent condition changes a value used later
What it means
A condition that is absent takes the false branch. During warmup, while an indicator in the condition has no value yet, a block under if rsi(close, 14) > 70 does not run, so a name it assigns keeps whatever it held before. Those bars sit off the left edge of the chart, which is why the shape can change an answer without anyone noticing.
Not raised yet. In version 0.5.0 the checker does not follow names assigned under a possibly absent condition, so this shape compiles without a warning. The before block below is refused for a different reason in this release: zone is first assigned inside the if, so it does not exist after the block (OS2001). The shape the warning describes needs a name that already exists above the if, such as a var. Decide what warmup means yourself: give the name its starting value above the if, as the fix does, or test the condition with isNone(). See Warmup.
How to fix it
Decide what warmup means: test isNone(condition) explicitly, or give name a starting value above the if.
Before
if rsi(close, 14) > 70
    zone = "high"
plot(zone == "high" ? 1 : 0, "Zone", aqua)
After
zone = "mid"
if rsi(close, 14) > 70
    zone = "high"
plot(zone == "high" ? 1 : 0, "Zone", aqua)
OS8011 live var makes live and backtest differ
What it means
A var keeps its value from one bar to the next, and on the forming bar it is rolled back before each update, so the script sees every bar once, exactly as a backtest does. A live var opts out: it keeps its value across the updates of the forming bar as well, which is what you need to count ticks or updates within a bar. A script that uses one gives different numbers on a real-time chart and in a backtest of the same data, by design.
Use var unless counting intrabar updates is the point of the script. See Persistence and Realtime and confirmation.
How to fix it
Use var unless counting intrabar updates is the actual intent; keep live var only for that.
Before
live var barCount = 0
barCount = barCount + 1
plot(barCount, "Bars", aqua)
After
var barCount = 0
barCount = barCount + 1
plot(barCount, "Bars", aqua)
OS8014 A persistent value holds a bar index
What it means
bar.index is a position in the bars the engine was given, not a fixed address. When more history loads, every bar is renumbered, so a var that stored a bar index and compares it later is comparing against a number that has moved.
Not raised yet. In version 0.5.0 the checker does not follow a bar index into a persistent value, so this compiles without a warning. Store time instead, as the fix does: a bar's time never changes. See Bars and history.
How to fix it
Store time instead and compare timestamps; the bar's time does not move.
Before
var entryBar = none
if enter
    entryBar = bar.index
After
var entryTime = none
if enter
    entryTime = time
Repainting
A study repaints when a value it showed on a past bar changes later. See Repainting.
OS8002 A higher timeframe read with onUnconfirmed
What it means
onUnconfirmed = true lets a script act inside a bar that is still forming. A higher timeframe read is itself incomplete until its own bar closes, so acting on it intrabar acts on a value that will change: the chart redraws when the higher bar closes, and a real-time run and a backtest of the same data disagree.
The warning appears on each higher timeframe read in a file that sets onUnconfirmed = true, and it stays even when you guard the uses with bar.isConfirmed, as a standing reminder of the combination. Drop onUnconfirmed unless the script really needs to act within the bar. See Realtime and confirmation.
How to fix it
Drop onUnconfirmed = true, or guard every use of the read with bar.isConfirmed.
Before
strategy("HTF", onUnconfirmed = true)
d = req.timeframe("1D", high)
if close > d
    buy(qty = 1)
After
strategy("HTF")
d = req.timeframe("1D", high)
if close > d
    buy(qty = 1)
OS8005 A lookahead read
What it means
A higher timeframe read with mode = "lookahead" gives each chart bar the final value of the higher bar it falls in, including bars before that higher bar closed. At 10:00 the study shows the day's high that was only known at 15:30. It is the strongest form of repainting there is, and it makes a backtest look far better than anything that could be traded.
Remove the mode to use the default, which never repaints, unless the study is deliberately about what the higher bar went on to do. See Higher timeframes.
How to fix it
Drop the mode to take the default, which never repaints, unless the study is deliberately a study of what the higher bar went on to do.
Before
d = req.timeframe("1D", high, mode = "lookahead")After
d = req.timeframe("1D", high)Plots and alerts
OS8006 A session average on a session-length bar
What it means
A session anchored average such as vwap() starts again at the first bar of each session and accumulates through the day. On a daily or longer chart every bar is a whole session, so the average covers one bar and equals that bar's own price: the plot adds nothing, while its legend suggests it does.
Not raised yet. In version 0.5.0 the checker does not compare the call with the chart's interval, so this compiles without a warning. Use a session average on an intraday chart, such as 5 or 15 minute bars across the 09:15 to 15:30 session. On the /trading chart, vwap() has no value in this release, because the chart does not state the session hours it restarts on; anchor the average by date with vwapAnchor(), as in vwapAnchor(hlc3, isNone(time[1]) or not date.isSameDay(time, time[1], "Asia/Kolkata")).
How to fix it
Use an intraday interval for a session anchored average, or plot the source directly and delete the call.
Before
plot(vwap(), "Session average", aqua)After
plot(hlc3, "Typical price", aqua)OS8007 A plot sets the price pane's own formatting
What it means
precision and format on a plot set how its price scale is labelled. A plot drawn over the price pane shares the instrument's own scale, so setting them there reformats the axis that the candles and every other series on the pane are read against, which is almost never what was meant.
Set precision and format in the declaration, for the whole study, or leave them off a plot drawn over price. See Settings and style.
How to fix it
Set precision and format in the declaration, for the whole study, or drop them from a plot drawn over the price pane.
Before
study("Bands", overlay = true)
plot(upper, "Upper", aqua, precision = 0)
After
study("Bands", overlay = true, precision = 0)
plot(upper, "Upper", aqua)
OS8008 An alert with no fixed id
What it means
An alert subscription is kept under the alert's id. Without a fixed id, the id is derived from the alert's position in the file, so inserting a line above it changes the id, and the subscription quietly stops firing. An id taken from an input() warns as well, because it could change whenever someone edits the settings.
Give every alert() an id string of its own, written as a literal, as the example at the top of this page does. See Alerts from scripts.
How to fix it
Give the alert a stable id of your own: alert("text", id = "emaCross").
Before
if crossUp(fast, slow)
    alert("EMA cross")
After
if crossUp(fast, slow)
    alert("EMA cross", id = "emaCross")
OS8009 This plot can never draw
What it means
A plot whose value is none on every bar still takes a legend row, a settings entry and a place on the scale, and draws nothing. It is usually a placeholder that was left behind, or a name that was never given the value it was meant to hold.
Plot the value you meant, or delete the plot.
How to fix it
Plot the value that was meant, or delete the plot and its settings row.
Before
plot(none, "Reserved", aqua)After
plot(ema(close, 20), "EMA 20", aqua)Code that does nothing
OS8010 A name is never read
What it means
A name that is assigned and never read still costs work on every bar, and it tells the next reader that something depends on it. It is usually what is left of a calculation that was replaced. A plot's handle counts too: p = plot(close, "Close") warns unless p is passed to fill().
Use the value, or delete the line.
How to fix it
Use the value, or delete the line.
Before
slow = ema(close, 21)
plot(ema(close, 9), "Fast", aqua)
After
plot(ema(close, 9), "Fast", aqua)OS8012 An ordered comparison against none is always absent
What it means
The ordered comparisons <, >, <= and >= give absent when either side is absent, and a comparison against none has an absent side on every bar. So the condition is absent on every bar, takes the false branch every time, and the block never runs.
To ask whether a value is absent, use isNone() or x == none, which are always true or false. See Absent values.
How to fix it
Test absence with isNone(x), or with x == none, both of which are always true or false.
Before
if value > none
    signal("READY")
After
if not isNone(value)
    signal("READY")
OS8015 This loop never runs
What it means
A for loop counts from its start to its limit in steps of its step, which is 1 unless you write one. for i = 9 to 0 starts above its limit and so runs zero times: a loop never reverses by itself, because a loop that could reverse is a loop that could run for ever by accident.
Write step -1 to count down, or swap the bounds to count up. See Control flow.
How to fix it
Add step -1 to count down, or swap the bounds to count up.
Before
for i = 9 to 0
    total += close[i]
After
for i = 9 to 0 step -1
    total += close[i]
OS8016 Unreachable code
What it means
return leaves a function at once, so lines after a return that always runs never execute. The usual cause is an early exit that lost its if.
Delete the unreachable lines, or move them above the return. See User functions.
How to fix it
Delete the unreachable lines, or move them above the return.
Before
fn pick(x) =>
    return x
    x * 2
After
fn pick(x) =>
    x
OS8017 The condition is constant
What it means
An if or else if whose condition is the literal true or false has the same answer on every bar, so one of its branches can never run. It is usually a test pinned while debugging and left behind.
In version 0.5.0 the warning covers only a bare true or false. A condition that is just as constant but written as an expression, such as if 1 > 2 or if not true, compiles without it, so look for those yourself.
Restore the condition you meant, or delete the branch that never runs. See Debugging.
How to fix it
Restore the test that was meant, or delete the branch that never runs.
Before
if true
    signal("BUY")
After
if crossUp(fast, slow)
    signal("BUY")
OS8018 An input is never used
What it means
Every input() adds a field to the study's settings dialog. When the script never reads the name the input assigns, you can change the field and nothing happens, which is worse than the field not being there at all.
Use the input, or delete it. See Inputs.
How to fix it
Use the name the input assigns, or delete the input() and its dialog row.
Before
len = input(20, "Length")
plot(ema(close, 9), "EMA", aqua)
After
len = input(20, "Length")
plot(ema(close, len), "EMA", aqua)
OS8019 A deleted object is still held
What it means
Deleting a drawing object with draw.delete() does not clear the name or the array element that refers to it: both still hold the deleted object. The next setter that reaches it stops the run with OS4005, often many bars after the line that caused it.
Not raised yet. In version 0.5.0 the checker does not follow a reference to a deleted object, so this compiles without a warning. Assign none to the name next to the delete, and when the object came out of an array, remove its element with shift() or remove() as well, as the fix does. See Lines and boxes.
Related. Reading an error, The editor, Repainting, Execution model, Style guide, OS4xxx Runtime errors
How to fix it
Assign none to the name on the same path as the delete, and where the object came out of an array, remove the element as well as deleting the object.
Before
var zones: array<box> = []
push(zones, draw.box(time, low, time, high))
if size(zones) > 20
    draw.delete(element(zones, 0))
After
var zones: array<box> = []
push(zones, draw.box(time, low, time, high))
if size(zones) > 20
    draw.delete(element(zones, 0))
    shift(zones)