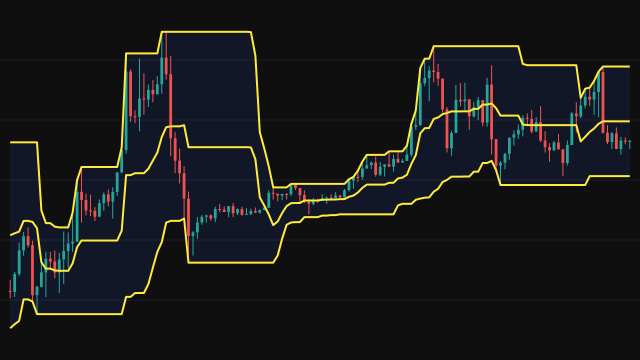
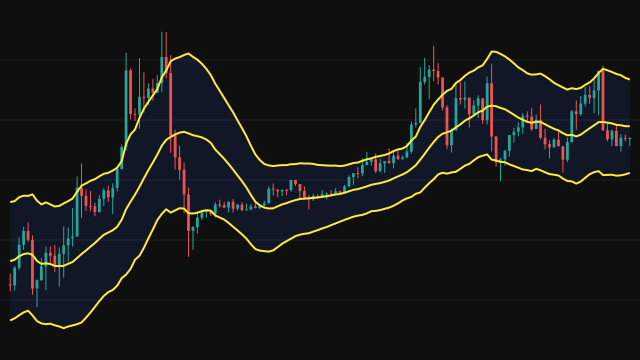
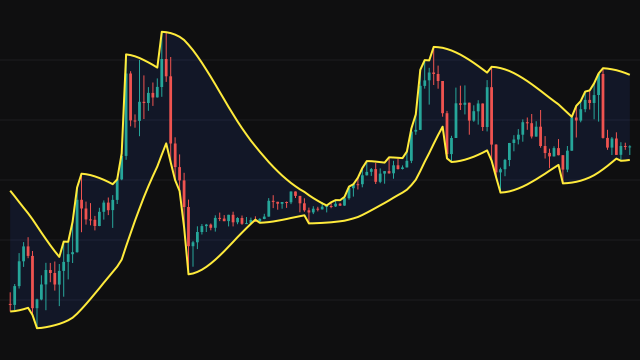
This study draws a basis line and two bands. The basis is the simple average of the source over the last period bars. The bands sit a multiple of the standard deviation of the same values above and below it, using the population form of the deviation.
The study keeps a running sum of the source and of its square. The variance is the mean of the squares minus the square of the mean, floored at zero because the subtraction can dip just below it on a flat series. Until a full period of bars exists, the sums cover every bar so far, so the first bar plots the source itself with a band of zero width, and the window grows to its full length after period bars.
Because the deviation is squared before it is averaged, large moves widen the bands more than small ones.
How to read Bollinger Bands (BBANDS)
Price near the upper band is high relative to its recent average and spread, and price near the lower band is low. A close outside a band is a move of more than the chosen number of deviations. Narrow bands mark a quiet stretch, which some traders watch for a larger move to follow; wide bands mark an active one.
In a strong trend price can walk along one band for many bars, so touching a band is not a reversal signal on its own. The first period bars use a shorter window and should be read with care.
Settings
- Period
- The number of bars in the average and in the standard deviation. Longer gives a smoother, slower channel.
- Source
- The price series the average and deviation are measured on, the close by default.
- StdDev Multiplier
- How many standard deviations the bands sit from the basis. Larger values give a wider channel.
Frequently asked questions
Why do the bands start with zero width?
With one value there is no spread to measure, so the deviation is zero and both bands sit on the basis. They open up as more bars join the window.
Is the deviation the sample or the population form?
The population form: the squared distances are divided by the number of values, not by one less.
What does a squeeze mean?
Narrow bands mean the source has moved little around its average. A squeeze says volatility is low, not which way the next move will go.