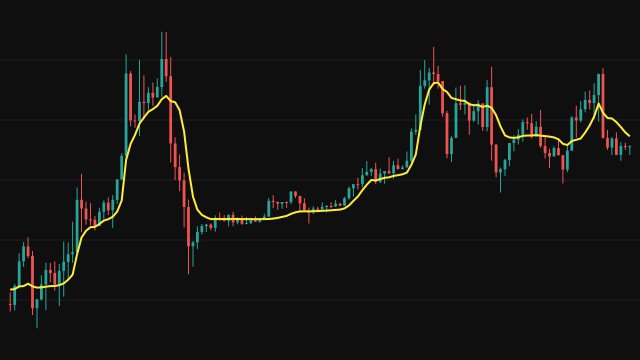
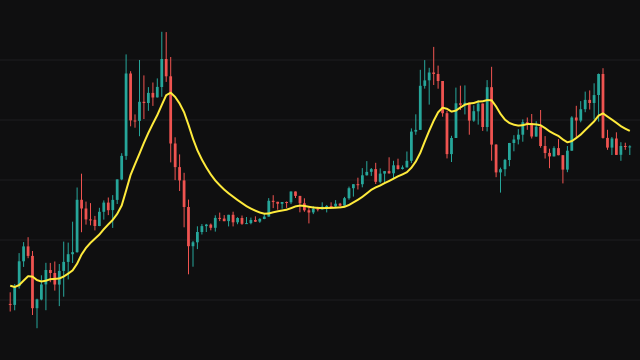
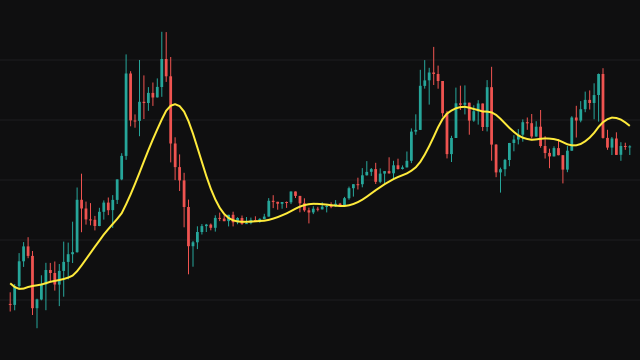
The DEMA computes an exponential average of the source, then an exponential average of that average, both with the weight 2 / (Period + 1). The plotted value is twice the first average minus the second. The gap between the two averages estimates how far the first one trails price, and adding that gap to the first average takes much of the lag out.
Both averages start from zero. Over the early bars each is divided by 1 - beta^n, where beta is 1 - 2 / (Period + 1) and n is the number of bars so far, which removes the bias of the zero start. Once beta^n falls below 1e-10 the correction stops, because it no longer changes anything. The line is drawn from the first bar.
How to read Double Exponential Moving Average (DEMA)
The DEMA follows price more closely than an EMA of the same period and turns sooner after a reversal. Price above a rising DEMA describes an uptrend and price below a falling one a downtrend; crossings of a short DEMA through a long one are a common trend-change trigger.
The lag correction can overshoot: after a sharp move the DEMA may run past price for a bar or two before settling. In a choppy market its speed also gives more false turns than a plain EMA.
Settings
- Period
- The length of both exponential averages. Longer is smoother and slower.
- Source
- The price series that is averaged, the close by default.
Frequently asked questions
Is this the same as an EMA of an EMA?
No. It uses an EMA of an EMA as a measure of lag, and plots twice the first EMA minus that, which sits closer to price than either.
Why is the line usable from the first bar?
Each average is divided by 1 - beta^n while that term is still meaningful, which removes the drag of starting from zero.