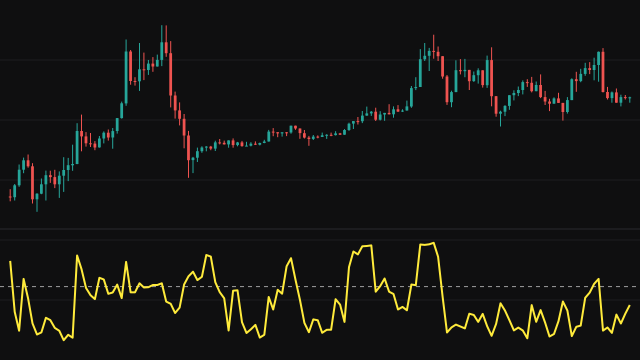
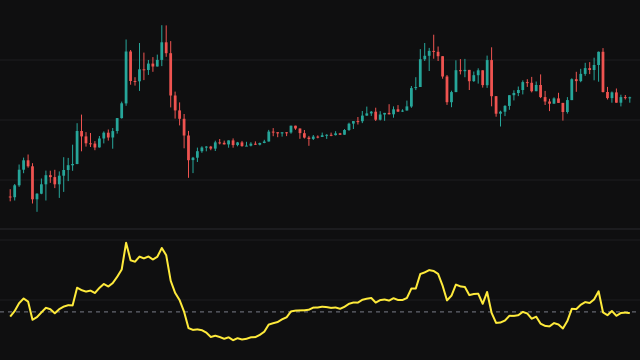
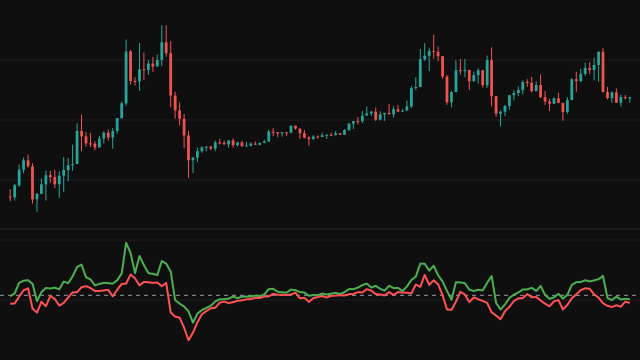
The Dynamic Momentum Index (DYMOI) is an RSI that changes its length bar by bar. It compares a short standard deviation of the source (5 bars by default) with a longer one (10 bars). The base period (14) is divided by that ratio and rounded, so a burst of recent volatility shortens the lookback and a quiet spell lengthens it, and the result is kept between the minimum and maximum periods.
The RSI is then smoothed with weight one over that changing period. Its averages start at zero and are scaled up while that starting bias decays, so it gives a value from the second bar. Both standard deviations use the bars available while their windows fill, and the result is held between 0 and 100.
How to read Dynamic Momentum Index (DYMOI)
Read it like an RSI: 70 and above is the usual overbought zone, 30 and below oversold, and 50 the balance point. The difference is in its speed. When the market turns volatile it shortens its lookback and reacts faster, and when the market calms it lengthens and steadies.
The adaptive length helps it keep up in fast markets, but it also means a single volatile stretch can push it to an extreme quickly. It can stay overbought or oversold for long periods in a strong trend.
Settings
- Base RSI Period
- The RSI length used when short and long volatility are equal; it is divided by their ratio.
- Short StdDev Period
- Length of the short standard deviation that measures recent volatility.
- Long StdDev Period
- Length of the long standard deviation used as the baseline; it is kept longer than the short one.
- Min Period
- The shortest RSI length the adaptive period may reach.
- Max Period
- The longest RSI length the adaptive period may reach.
- Source
- The price series the calculation reads, such as the close or the bar midpoint.
Frequently asked questions
When does the lookback get shorter?
When the short standard deviation rises relative to the long one, which is what happens when the latest bars are more volatile than the recent norm.
How is it different from a fixed RSI?
A fixed RSI uses the same length on every bar. This one varies between the minimum and maximum period, so it reacts faster in volatile spells.
Why does it read 50 on the first bar?
There is no earlier price to compare with, so there is no gain or loss yet and the reading is the neutral 50.