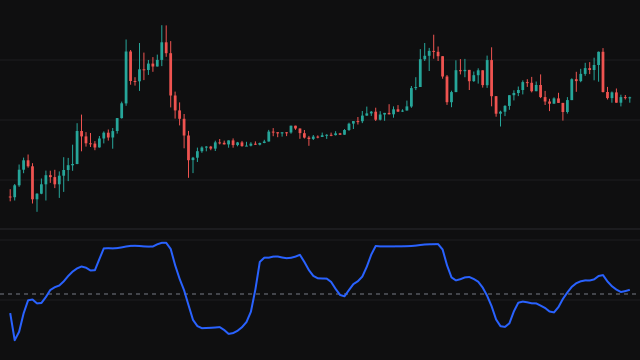
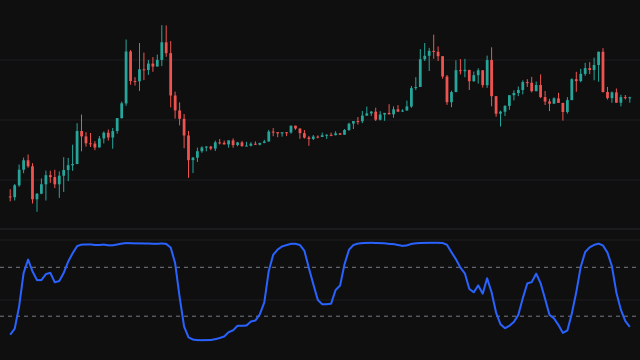
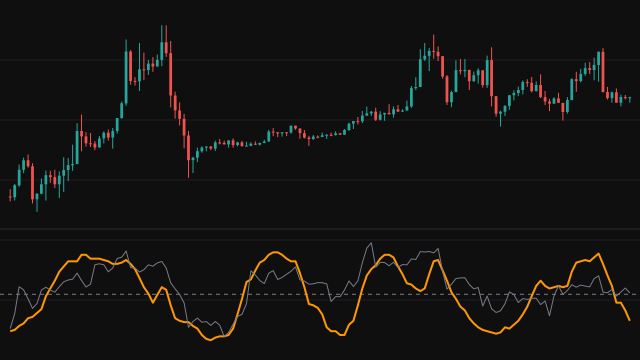
John Ehlers designed the Rocket RSI to make the turns of an RSI easier to see. It starts from momentum, the source minus its value RSI Length - 1 bars back, and smooths it with a two-pole super smoother whose length is Smooth Length (8 by default). The smoother works on the average of this bar's and the previous bar's momentum, which removes the shortest wiggles before anything else is done.
Over the last RSI Length changes of the smoothed momentum (10 by default), the rises are added into one sum and the falls into another. Their balance, (rises - falls) / (rises + falls), runs from -1 to 1 like an RSI centred on zero. It is held inside plus and minus 0.999 and passed through the Fisher transform, 0.5 * ln((1 + x) / (1 - x)), which leaves values near zero almost unchanged but stretches values near the ends into tall spikes. If the smoothed momentum does not move at all in the window, the previous reading is kept.
How to read Ehlers Rocket RSI
Most of the time the line moves between about -2 and 2. A spike beyond the Overbought and Oversold Level (2 by default) marks a stretched move: above the upper line the recent rises have dominated almost completely, below the lower line the falls have. A turn back inside the level after such a spike is the reading Ehlers drew attention to, as a hint that the swing is exhausted. Crossings of zero show the balance of smoothed momentum changing side.
Because the Fisher transform stretches the extremes, the spikes are much larger than the moves in the middle, so compare the line with the levels rather than with its own recent size. The study looks back only over a short window, and in a strong trend it can stay beyond a level for many bars.
Settings
- Source
- The price series the momentum is taken from. Close is the default.
- Smooth Length
- Length of the super smoother applied to the momentum. Longer is smoother and slower to turn.
- RSI Length
- Bars in the momentum and in the window of rises and falls. Shorter reacts faster and spikes more often.
- Overbought and Oversold Level
- Where the upper and lower reference lines are drawn, as plus and minus this value. It changes only the lines, not the calculation.
Frequently asked questions
Why does the line spike so sharply?
The Fisher transform grows quickly as its input nears plus or minus 1, so a window of almost only rises or almost only falls becomes a tall spike. The input is held at 0.999 so the largest possible reading is about 3.8.
How is it different from a normal RSI?
It is centred on zero instead of 50, it works on smoothed momentum rather than on bar to bar price changes, and the Fisher transform turns the result into a scale where extremes stand out.
Does the level setting change the line?
No. It only moves the two dashed reference lines; the line itself depends on the source and the two lengths.