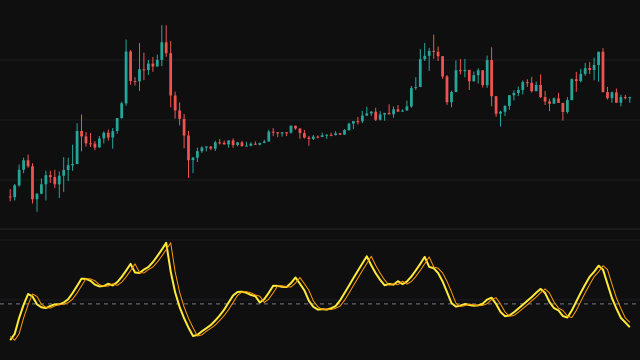
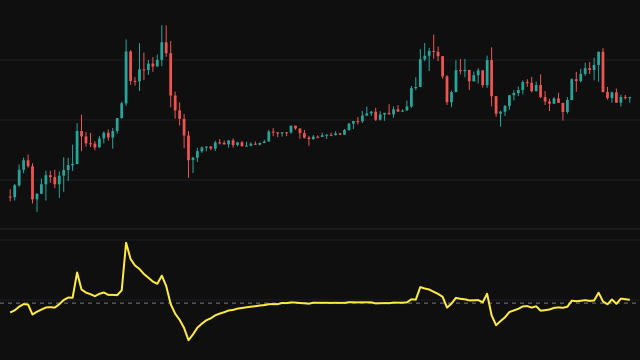
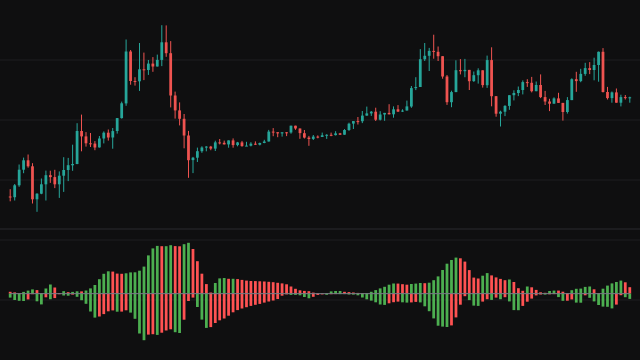
The Fisher Transform turns the position of price within its recent range into a line with sharp, well-defined turns. On each bar it takes the source (the bar midpoint by default) and finds where it sits between the highest and lowest values of the source over the period, scaled to run from -1 at the low to +1 at the high. While the window is still filling, or when the range is flat, the position reads as the middle, zero.
That position is smoothed with an exponential weight of 0.33 and held just inside -0.999 to 0.999. The study then applies the inverse hyperbolic tangent, half the natural logarithm of (1 + value) / (1 - value), which stretches values near the edges far out. The Signal line is the same exponential smoothing, weight 0.33, applied to the Fisher line.
How to read Fisher Transform
Readings beyond +2 and -2 mark price pressing against the top or bottom of its recent range for several bars, and the stretch of the transform makes those extremes stand out. A turn of the Fisher line from an extreme, and especially its cross of the Signal line, is the usual cue that the move is losing steam.
In a strong trend the line can stay pinned near an extreme for a long time, so a high reading alone is not a reason to fade the move. Shorter periods give more frequent and sharper turns.
Settings
- Period
- The number of bars the highest and lowest values are taken over. A shorter window makes the line swing to its extremes more often.
- Source
- The price series placed inside its range. The default is the bar midpoint, the average of high and low.
Frequently asked questions
Why is the value clamped at 0.999?
The inverse hyperbolic tangent grows without bound as its input approaches 1. Holding the smoothed value just inside the bounds keeps the line finite.
What is the Signal line?
An exponential average of the Fisher line with the same 0.33 weight. It lags the Fisher line slightly, so their crossings mark turns.
Why does the line start at zero?
Until the period has passed, the range is not yet known, so the position reads as the middle and the smoothed value builds up from zero.