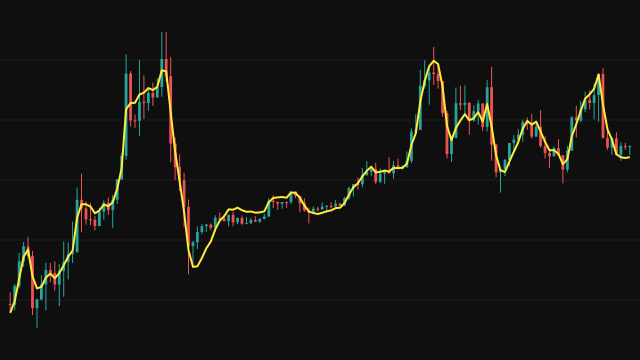
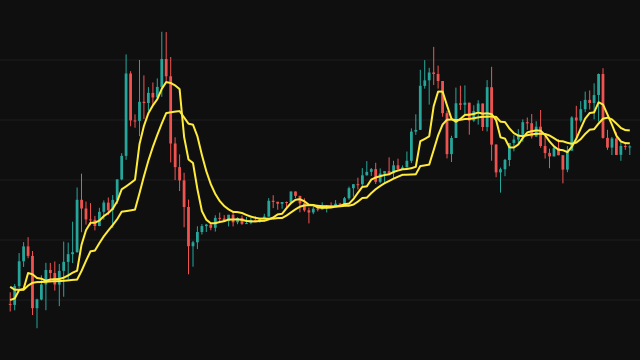
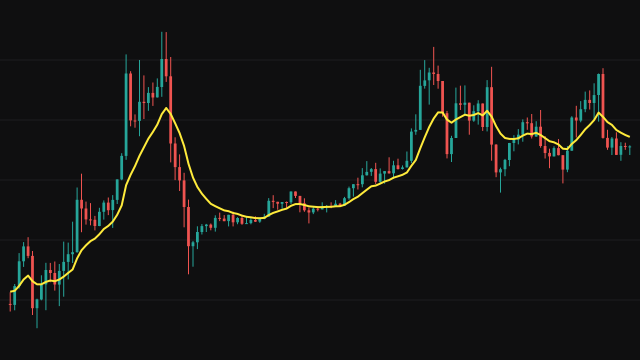
The MAVP is an exponential moving average built around a period that is held between a minimum and a maximum. The base period is clamped into that range, and the smoothing factor is two divided by the clamped period plus one. In this study the period is the same on every bar, so the line is an exponential average of the clamped length.
The running average starts at zero. During warmup it is divided by one minus (1 - alpha) raised to the number of bars seen, which removes the pull toward zero and makes the first bar equal the source. Once (1 - alpha) raised to the bars seen falls below 1e-10, the correction is dropped and the line is the plain recursion. A missing source value is read as zero so the recursion never breaks. If the maximum is set below the minimum, the maximum is lifted to the minimum so the line still draws.
How to read Moving Average Variable Period (MAVP)
Read it like any exponential average. A rising line with price above it describes an uptrend, a falling line with price below it a downtrend, and the distance between price and the line shows how stretched the move is.
The minimum and maximum period only matter when the base period falls outside them: a base period below the minimum is raised to it and one above the maximum is lowered to it. With the defaults the line is a 10-bar exponential average.
Settings
- Period
- The base period of the exponential average before it is clamped.
- Min Period
- The shortest period allowed. A base period below it is raised to this value.
- Max Period
- The longest period allowed. A base period above it is lowered to this value.
- Source
- The price series that is averaged, the close by default.
Frequently asked questions
Does the period change from bar to bar?
Not in this study. The per-bar period is the base period on every bar, clamped between the minimum and the maximum, so the line is an exponential average of one fixed length.
What happens if the maximum is below the minimum?
The maximum is raised to the minimum, so the period becomes the minimum and the line keeps drawing instead of failing.
Why does the line start on the first bar?
The average starts at zero and is divided by a warmup correction that removes that zero start. The first value equals the source and the correction fades out as bars arrive.