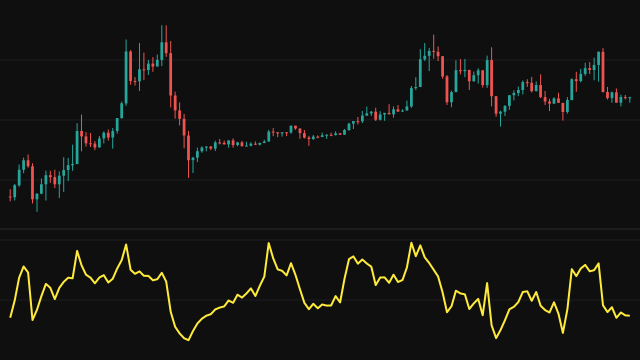
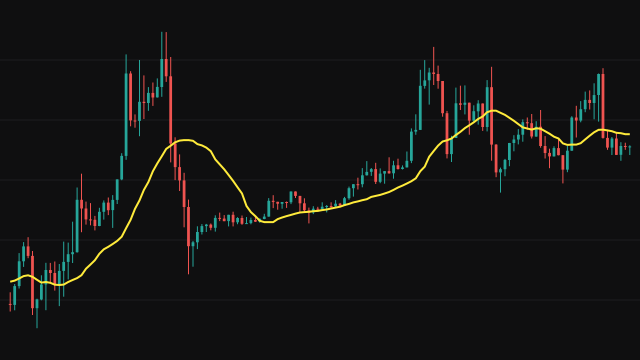
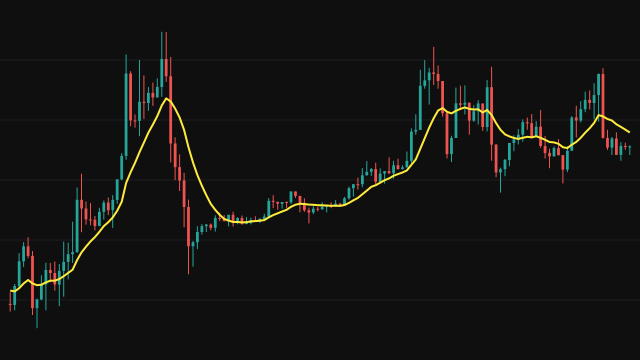
The study tests the mean of the last Period values of the source against a hypothesized mean. It keeps running sums of the values and their squares, takes the sample mean, and builds a sample standard deviation with the usual n / (n - 1) correction. The standard error is that deviation divided by the square root of the number of values, and the t-statistic is the gap between the sample mean and the hypothesized mean divided by the standard error.
The test answers from the second bar, because two values are enough for a sample variance, and it uses all the bars held until the window is full. Absent values are left out of the window. When the standard error is effectively zero the bar is left blank.
The reading is most meaningful when the source is something centred near zero, such as a returns series, rather than raw price.
How to read One-Sample t-Test (ZTEST)
A value near zero means the recent mean is not distinguishable from the hypothesized mean. Readings beyond the dashed lines at plus or minus 2.04 and 2.75 correspond roughly to the 95 and 99 percent levels for a window of about 30 values. A sustained reading above them suggests the recent mean is reliably above the hypothesized value, and below them that it is reliably under it.
Applied to raw price the statistic will be very large, because price is far from zero, so either set the hypothesized mean near the price level or edit the script to test a change series, such as the close minus the previous close. The Source menu offers only price series. Overlapping windows are not independent, so treat the levels as a guide rather than a strict test.
Settings
- Source
- The price series being tested. The menu offers only price series, so a returns test needs a small edit to the script.
- Period
- How many recent values form the sample. A longer period gives a steadier statistic.
- Hypothesized Mean
- The value the sample mean is tested against. Use 0 when testing returns.
Frequently asked questions
Why are the readings so large on price?
The statistic measures the distance from the hypothesized mean in units of standard error. With the default hypothesized mean of 0 and a price in the thousands, that distance is enormous. Set the hypothesized mean near the price, or edit the script so it tests a change series instead of price.
What do the dashed lines mean?
They mark plus and minus 2.04 and 2.75, roughly the two-sided 95 and 99 percent critical values for about 30 observations. A reading outside them is the kind a sample would rarely produce if the true mean equalled the hypothesized one.
Why does it start on the second bar?
A sample standard deviation needs at least two values, so the first bar has no reading. After that the window grows until it holds the full period.