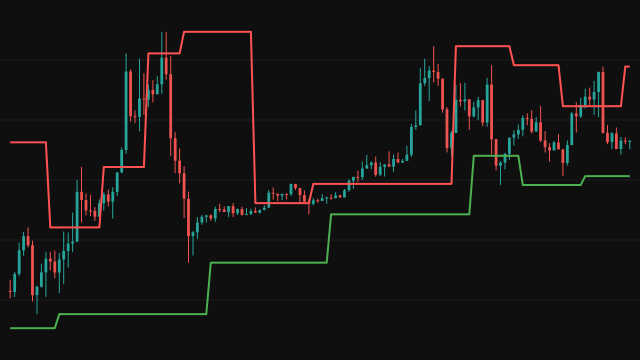
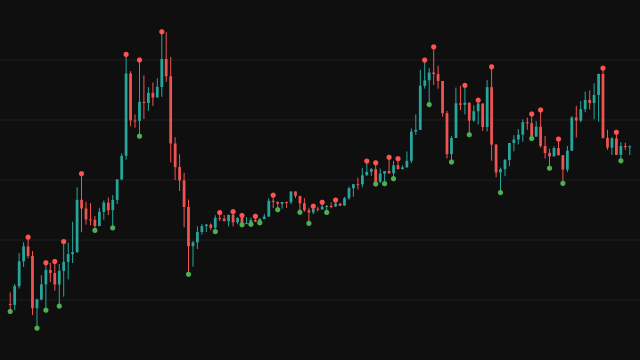
Parabolic SAR (stop and reverse) draws a stop level on every bar that trails the trend. In an uptrend it sits below price and climbs; in a downtrend it sits above price and falls. Each bar the stop moves toward the extreme point of the trend, the highest high of an uptrend or the lowest low of a downtrend, by a fraction called the acceleration factor.
The factor starts at Start AF and grows by AF Increment every time the trend sets a new extreme, up to Max AF, so the stop closes in faster the longer a trend runs. A rising stop is never allowed above the lows of the previous two bars, and a falling stop never below their highs. When a bar trades through the stop, the side flips: the stop jumps to the old extreme point and the factor starts again.
The first bar picks the starting side from its own direction (up when it closed above its open) and starts the stop at the far end of its range. The study draws the stop as two lines, PSAR Above in red on bars where it sits above the close and PSAR Below in green where it sits below.
How to read Parabolic SAR
The green line under price marks an uptrend and the red line over price marks a downtrend. A switch from one line to the other is a reversal of the system: the previous trend's stop was hit. The line can serve as a trailing stop for an open position, moving the exit to each new stop value.
The study works best in a steady trend. In a sideways market price crosses the stop often, so it flips back and forth and each flip is small and late. Raising the factors makes the stop follow price more closely and flip more often; lowering them gives the trend more room.
Settings
- Start AF
- The acceleration factor at the start of each trend. A higher value pulls the first stops closer to price.
- AF Increment
- How much the factor grows each time the trend makes a new extreme, so how quickly the stop closes in.
- Max AF
- The ceiling on the factor. A value at or below Start AF is lifted to Start AF, and the factor then never grows.
Frequently asked questions
Why do the lines break on some bars?
Each bar's stop goes on the red line when it sits above the close and on the green line when it sits below. On a bar where the stop sits exactly on the close, neither line has a value, so the bar shows nothing. Each flip of side also ends one line and starts the other.
Why does the stop jump so far when it flips?
On a reversal the stop moves to the extreme point of the trend that just ended, the highest high of an uptrend or the lowest low of a downtrend, which can be some distance from price.
What happens if Max AF is set below Start AF?
The ceiling is lifted to the start value, so the factor stays at Start AF for the whole trend and the stop approaches price at a constant rate.