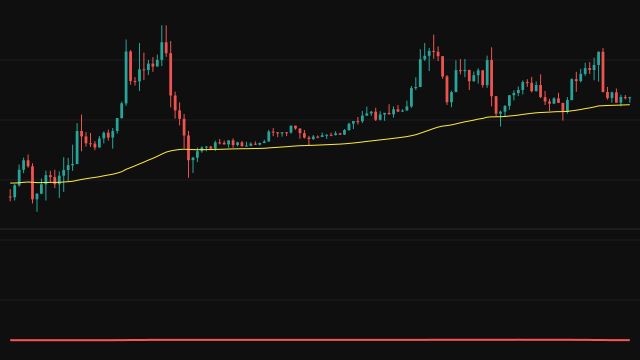
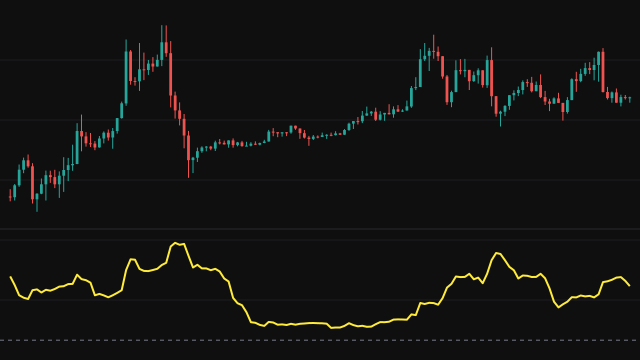
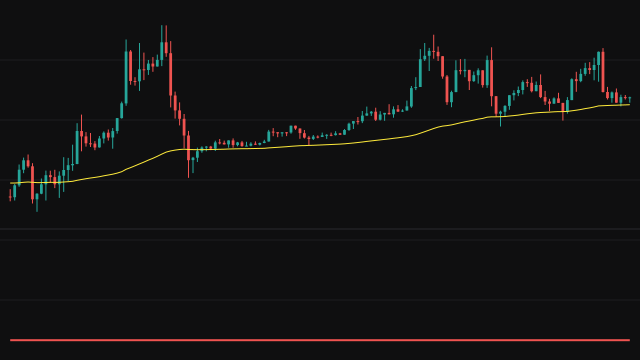
Relative Absolute Error (RAE) asks whether an exponential moving average tracks price better than a flat rolling mean does. The exponential average uses Period as its length and starts from the simple average of its first Period values, so it has no value through that warmup. The baseline is the mean of the source over the last Period bars, including this one; before that many bars have passed it is the mean of every bar so far.
On every bar the study takes the absolute gap between the source and the exponential average, and the absolute gap between the source and the baseline mean. Each is totalled over the last Period bars, counting only the bars that carry a value. RAE is the first total divided by the second. When the baseline total is zero the reading is 1. The exponential average is drawn on the price chart.
How to read Relative Absolute Error (RAE)
Below 1, the exponential average has been a closer fit to price than the flat mean of the window; above 1, it has been a worse fit. In a steady trend the exponential average follows price while the flat mean lags far behind, so RAE drops well below 1. In a choppy range the flat mean sits in the middle of the noise and is hard to beat, so RAE moves toward or above 1.
The first bar reads 1, and the line then has no value until the exponential average starts on bar Period minus one. The ratio says which fit was better, not how large either error was.
Settings
- Source
- The series being fitted by both the exponential average and the rolling mean.
- Period
- The length of the exponential average and of the window used for the baseline mean and both error totals.
Frequently asked questions
What does a reading of 0.5 mean?
The exponential average's absolute misses over the window added up to half of the flat mean's misses, so it fitted price about twice as closely.
Why does the very first bar show 1?
On the first bar the baseline mean is that bar's own value, so the baseline error is zero, and a zero baseline is reported as 1.
How is it different from the Relative Squared Error?
This one totals absolute gaps, so every point of error counts the same. The squared version gives large gaps much more weight.