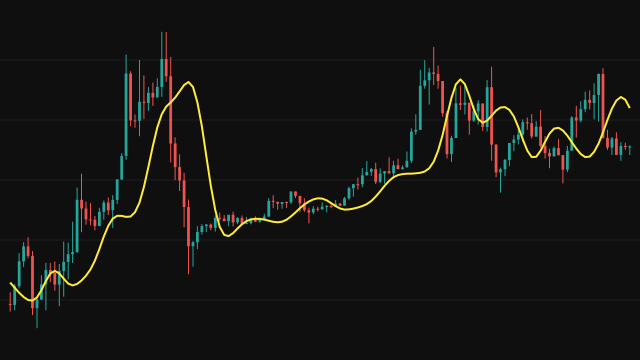
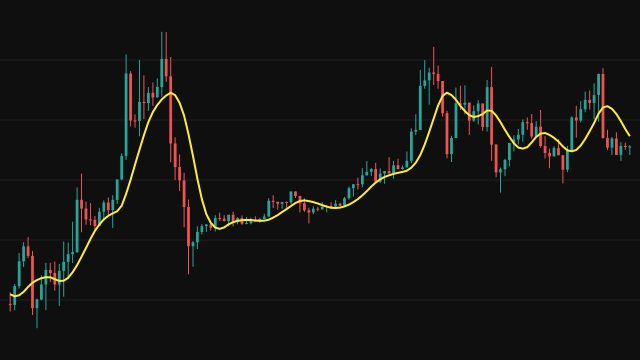
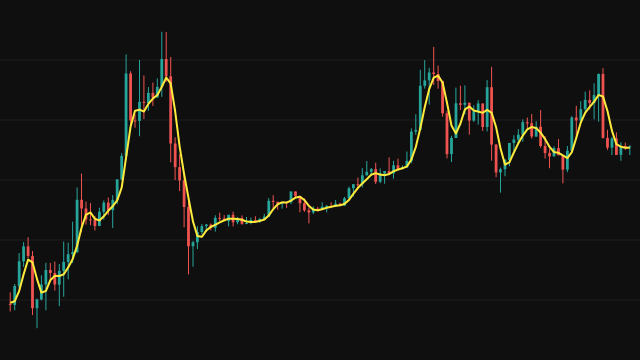
The Simple Moving Average adds up the source over the last period bars and divides by the number of bars. Every bar in the window counts the same, so the line is the centre of gravity of recent prices, and it trails behind them by roughly half the window.
This version keeps a running total rather than waiting for a full window. On the first bars of the chart it averages every bar seen so far, so the line starts on bar one and settles into the ordinary windowed average once period bars exist. A missing price is counted as zero.
How to read Simple Moving Average (SMA)
Price above a rising average is the usual picture of an uptrend, and price below a falling one of a downtrend. A flat average with price weaving across it says the market has no direction over that window. Many traders watch for the close crossing the line, or for a short average crossing a long one, as a sign the trend may be turning.
The average reacts late by design: it only turns after enough new prices have outweighed the old ones. The first period - 1 bars use a shorter window and so move more than the settled line does.
Settings
- Period
- How many bars are averaged. A longer period gives a smoother, slower line.
- Source
- The price series that is averaged, the close by default.
Frequently asked questions
Why does the line start on the first bar instead of after the period?
Until the window is full it averages all the bars seen so far, so the first values come from a shorter window. From bar period on it is the usual windowed mean.
How far behind price does it lag?
About half the period. A 10-bar average reflects prices centred roughly five bars ago, which is why it turns after the market has already turned.
Why use it over a weighted or exponential average?
It is the easiest to reason about: every bar counts equally and a bar leaves the average exactly period bars after it arrived. The cost is more lag than averages that weight recent bars more.