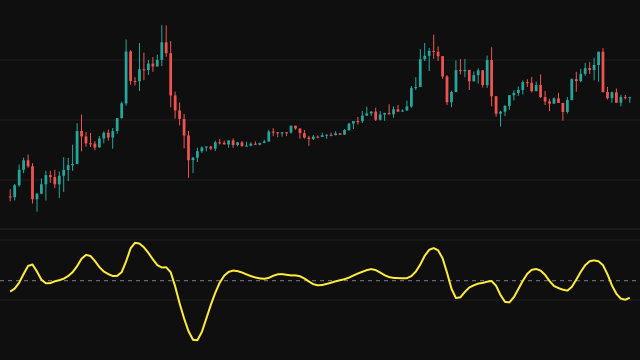
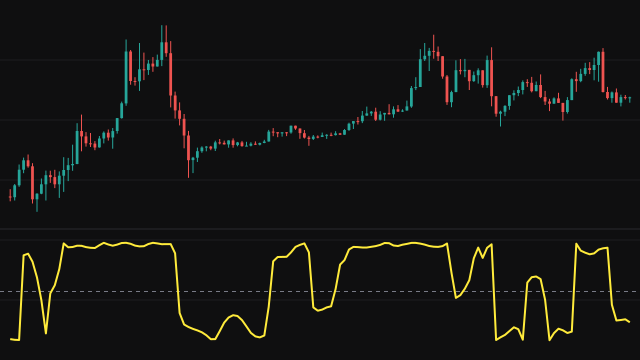
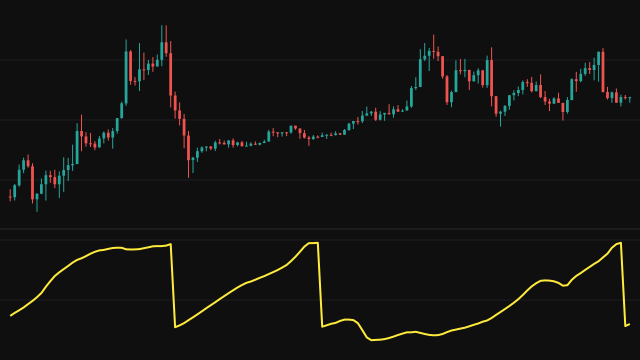
Solar Cycle is a pure calendar series: it never reads price or volume. For each bar it takes the bar's open time, converts it to a Julian date and then to Julian centuries since the J2000 epoch, and works out where the Sun sits on the ecliptic using the standard low precision solar formulas: the Sun's mean longitude, its mean anomaly, and the equation of centre that corrects one into the other.
The result is the sine of that apparent longitude. It reads 0 at the March and September equinoxes, rises to +1 at the June solstice and falls to -1 at the December solstice, so one full wave takes one year. On an hourly chart the line moves very slowly; it is meant to line seasonal studies up with the astronomical year rather than to move with the market.
The study also marks the four turning points. Peak Summer and Peak Winter are drawn on the curve on the bar where it turns after sitting beyond +0.985 or -0.985, and Spring Rise and Autumn Fall are drawn on the zero line on the bar where the curve crosses it upward or downward.
How to read Solar Cycle (SOLAR)
Read the line as the season, not as a signal. A value near +1 means the bars fall close to the June solstice, near -1 close to the December solstice, and a crossing of zero is an equinox. Put it beside a price study to see whether a market's behaviour lines up with the time of year, or use the marks as dates for comparing one year with the next.
It says nothing about price by itself, and any link between the solar year and a market is something you have to test on your own data. On an intraday chart a few weeks of bars cover only a small slice of the wave, so expect long stretches with no marks at all.
Frequently asked questions
Does this study use price at all?
No. Every value comes from the bar's time alone, so two instruments on the same timeframe show exactly the same line.
Why is the line so flat on an hourly chart?
One full wave takes a year. A few weeks of hourly bars cover only a small part of it, so the line drifts slowly and the four marks appear only when the chart spans a solstice or an equinox.
How accurate are the solstice and equinox marks?
They use the low precision solar position formulas, which place the Sun to within about a hundredth of a degree. An equinox mark lands on the first bar at or past the zero crossing, and a solstice mark on the first bar after the curve turns, so on an hourly chart a mark can sit an hour or so away from the exact astronomical moment.
Which hemisphere does it follow?
The labels follow the northern hemisphere calendar: +1 is the June solstice. In the southern hemisphere the seasons are the other way round, but the astronomical events fall on the same bars.