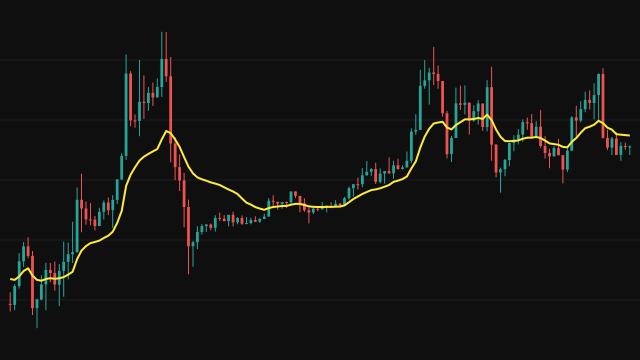
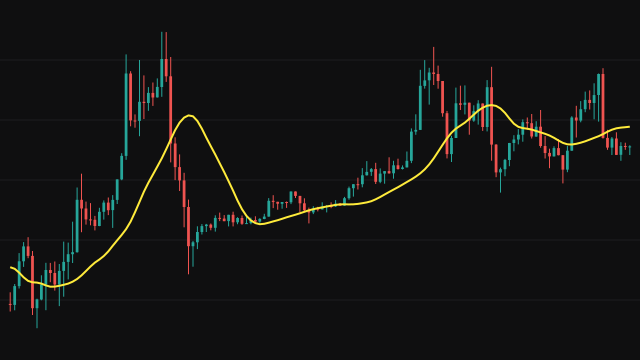
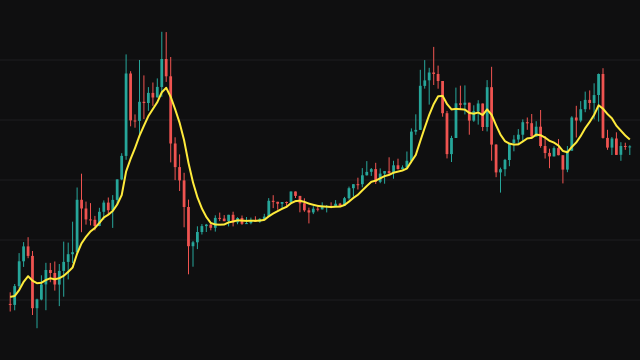
VAMA is a simple moving average with a window that changes every bar. It compares a long-term ATR with a short-term ATR: the base length is multiplied by long ATR divided by short ATR, held between the minimum and maximum length, and cut to a whole number of bars. The line is the mean of the newest values within that window.
Both ATRs smooth the true range with a factor of one over their period; they start at zero and are divided by a warmup correction, so they answer from the first bar. On the first bar the true range compares the bar's high and low with its own close. When short-term volatility runs above its longer average the ratio falls and the window shortens; when it runs below, the window lengthens. A minimum length set above the maximum is lowered to the maximum.
How to read Volatility Adjusted Moving Average (VAMA)
When the market turns volatile, VAMA shortens its window and follows price closely, so it reacts quickly to a fast move. When the market calms, it lengthens the window and smooths through small fluctuations. Price above a rising VAMA describes an uptrend and below a falling one a downtrend.
Because the window length changes, the line can step when the length jumps by several bars at once. The minimum and maximum length bound how fast and how slow it can become, so set them around the range of periods that makes sense for the timeframe.
Settings
- Base Length
- The window length when short and long ATR are equal. The volatility ratio scales it up or down.
- Source
- The price series that is averaged, the close by default.
- Short ATR Period
- The smoothing length of the ATR that measures current volatility.
- Long ATR Period
- The smoothing length of the ATR used as the reference volatility.
- Minimum Length
- The shortest window the average may use, however volatile the market is.
- Maximum Length
- The longest window the average may use, however calm the market is.
Frequently asked questions
Does the window get shorter or longer when volatility rises?
Shorter. The length is the base length times long ATR over short ATR, so a jump in short-term volatility lowers the ratio and the average responds faster.
Why does the line sometimes step?
The window is a whole number of bars and can change by several bars from one bar to the next, which shifts the mean in one move.
What happens if the minimum length is above the maximum?
The minimum is lowered to the maximum, so the window is fixed at the maximum length.