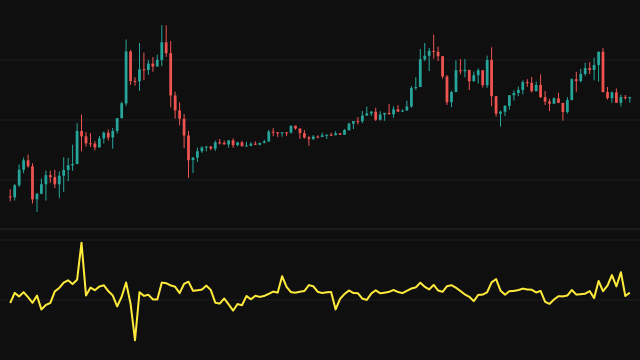
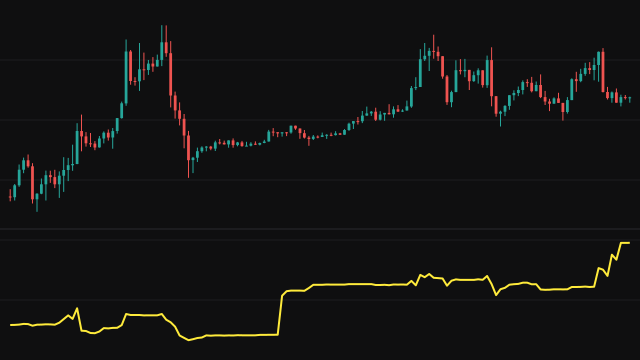
The Volume Oscillator compares recent volume with longer-run volume. It takes a short average and a long average of each bar's volume and reports how far the short one sits above or below the long one, as a percentage of the long one. A reading of +20 means the last few bars traded 20% more than the longer window did on average.
Both averages are simple means over their periods, but they answer from the first bar: until a window has filled, each averages however many bars it has. Each bar's volume is read as at least 1, so a bar without volume never causes a division by zero.
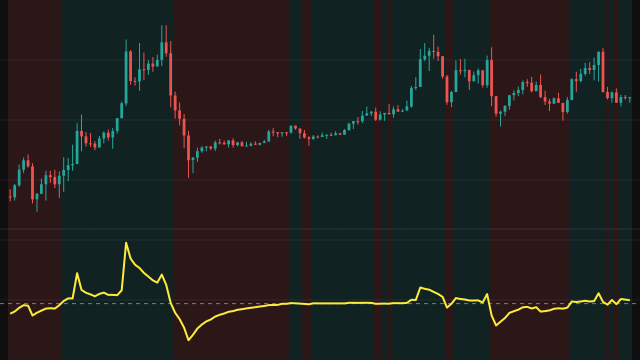
A signal line, the same kind of mean of the oscillator over the signal period, is drawn alongside it to smooth out single spikes.
How to read Volume Oscillator (VO)
Above zero, volume is expanding: the recent bars are busier than the longer window. Below zero, it is contracting. Breakouts that come with the oscillator rising above zero have more participation behind them than those that come while it sits below zero, and a trend that continues while the oscillator falls is running on fading interest.
The oscillator says nothing about direction, only about activity, so read it beside price. Use the signal line to judge whether a rise is sustained or a one-bar spike, and expect the first bars of the chart to be rough because the averages are still filling.
Settings
- Short Period
- The number of bars in the fast volume average. A shorter period reacts sooner to a burst of volume.
- Long Period
- The number of bars in the slow volume average that the fast one is measured against.
- Signal Period
- The number of bars averaged to draw the signal line from the oscillator.
Frequently asked questions
Does a positive reading mean price will rise?
No. It means recent volume is above its longer average. That can happen on a sharp fall as easily as on a rally, so read it with price direction.
Why does the line start on the first bar?
The averages divide by the number of bars available until the window fills, so they answer from the first bar instead of waiting out a warmup.
What happens on bars with no volume?
Volume is read as at least 1 on every bar, so the averages stay above zero and the percentage is always defined.