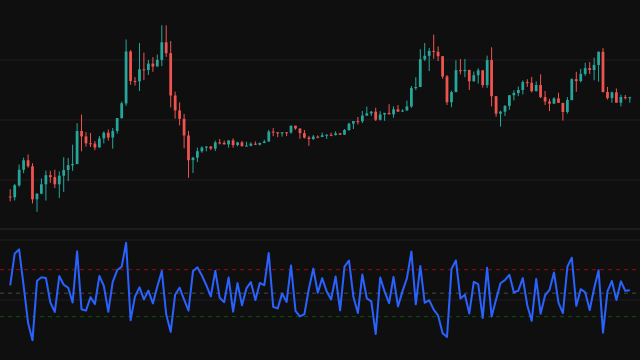
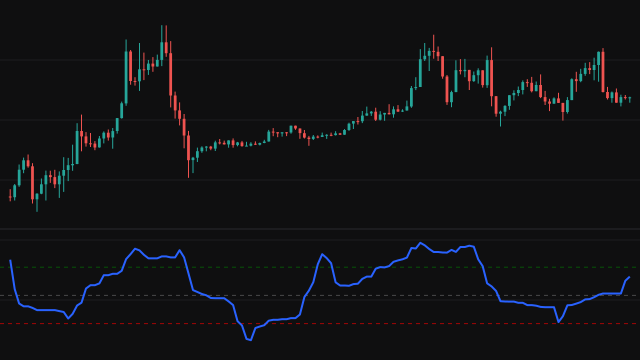
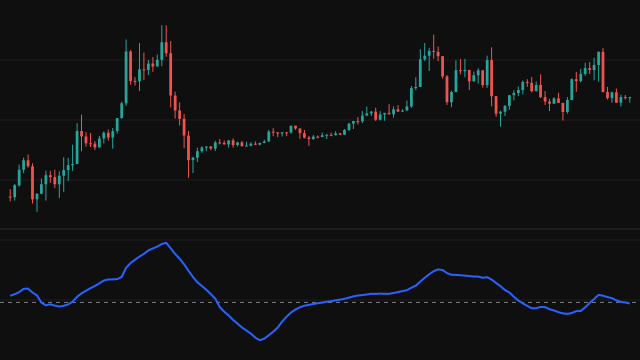
The Absolute Strength Histogram splits price movement into a bull part and a bear part and tracks each on its own, rather than netting them into one line as most oscillators do.
With the RSI method, each bar's change in the source is the raw strength: bulls = 0.5 * (abs(change) + change) and bears = 0.5 * (abs(change) - change), so a rise counts fully as bull strength and a fall fully as bear strength. With the Stochastic method, bulls are the distance of the source above the lowest value of the last Length bars and bears its distance below the highest. With the ADX method, each bar reads the directional moves behind the directional movement index: bulls = 0.5 * (abs(high - high[1]) + (high - high[1])), the rise of the high, and bears = 0.5 * (abs(low[1] - low) + (low[1] - low)), the fall of the low; this method reads the bars' highs and lows and ignores Source.
Both raw series are averaged over Length bars (9 by default) and the averages smoothed again over Smoothing bars (3 by default), with the average chosen in Average Type: simple, exponential, weighted or Wilder's. The pane shows smoothed bulls and smoothed bears as two lines and their difference as a histogram, teal above zero and red below.
How to read Absolute Strength Histogram (ASH)
When the bulls line is above the bears line the histogram is above zero and buyers hold the upper hand; when bears lead it falls below zero. A crossing of the two lines, which is the histogram crossing zero, is the usual signal of a change in control. The gap between the lines shows how one-sided the market is, so a shrinking histogram during a trend warns that the leading side is weakening.
Both lines rising together means a volatile market with large moves in both directions, and both falling a quiet one. The double smoothing makes the lines steady but late, so expect crossings a few bars after the turn in price.
Settings
- Source
- The price series the RSI and Stochastic methods measure strength on. Close is the default; the ADX method reads the highs and lows instead.
- Method
- RSI measures strength from each bar's change; Stochastic from the distance to the window's lowest and highest values; ADX from how far the high rises and the low falls from the bar before.
- Length
- Bars the raw bull and bear strength are averaged over, and the window of the Stochastic method. 9 is the usual value.
- Smoothing
- Bars the two averages are smoothed over a second time. A larger value gives steadier lines and later crossings.
- Average Type
- The average used for both passes: simple (SMA), exponential (EMA), weighted (WMA) or Wilder's smoothing (RMA).
Frequently asked questions
How is this different from RSI?
RSI divides the average gain by the average loss and shows one number. This study keeps the two averages apart, so you can see whether a reading comes from strong buying, weak selling or both.
Which method should I use?
RSI reacts to the size of each bar's change and suits trend following. Stochastic measures where price sits within its recent range and responds faster near tops and bottoms of a range. ADX counts only the part of each bar that reaches beyond the previous bar's high or low, so an inside bar adds nothing to either side.
Why does it start later with the Stochastic method?
The Stochastic method needs a full window of Length bars before its first raw value, and then both averages need their own windows, so the first histogram bar comes a few bars later than with the RSI method.