The Trend Trigger Factor, designed by M. H. Pee, measures which side controls the market by comparing two back to back windows of Length bars (15 by default). Buy power is the highest high of the latest window less the lowest low of the earlier window: how far buyers have lifted price above where it recently traded. Sell power is the highest high of the earlier window less the lowest low of the latest one: how far sellers have pushed it below.
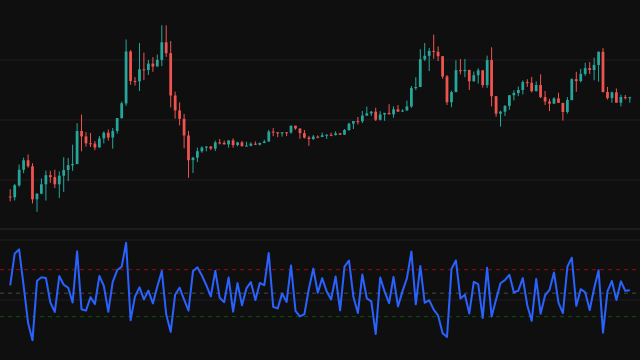
The factor is the difference between the two, as a percentage of their mean: 100 * (buy - sell) / (0.5 * (buy + sell)). It is drawn as a line in its own pane with dashed levels at plus 100, zero and minus 100. The first value appears once two full windows of bars are available, and a bar where both powers are zero has no value.
How to read Trend Trigger Factor (TTF)
A reading above zero means buy power exceeds sell power: the latest highs reach further above the earlier lows than the earlier highs reach above the latest lows. A reading above plus 100 is the classic trigger of a strong up trend, and a reading below minus 100 the trigger of a strong down trend. The original rules buy when the line crosses above plus 100 and sell when it crosses below minus 100.
Because the windows are made of highs and lows, one wide bar can move the line sharply and keep it there until that bar leaves the window. In a sideways market the line swings between the levels without a lasting trend.
Settings
- Length
- Bars in each of the two windows. 15 is the published value; a shorter window reacts faster and triggers more often.
Frequently asked questions
Why can the value go beyond 100?
The difference of the two powers is divided by their mean, not their sum, so when one power is much larger than the other the result runs past 100. It is exactly 200 when sell power is zero, and further out still when the latest lows sit above the earlier highs and sell power turns negative.
When does the first value appear?
After two full windows: by default on the 30th bar, because buy and sell power each read one window of the latest bars and one window of the bars before them.
Is it a trend or a momentum indicator?
Both readings are useful. The sign shows which side dominates, and the plus and minus 100 levels mark when that dominance is strong enough to call a trend.