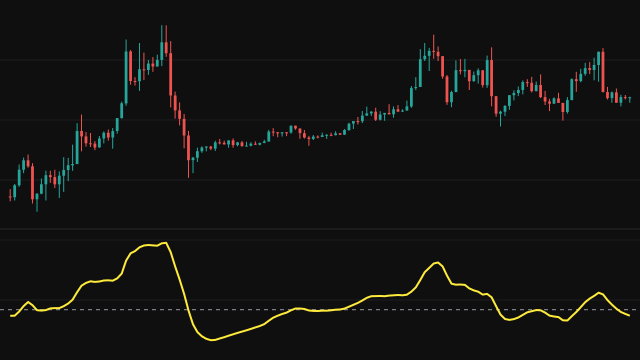
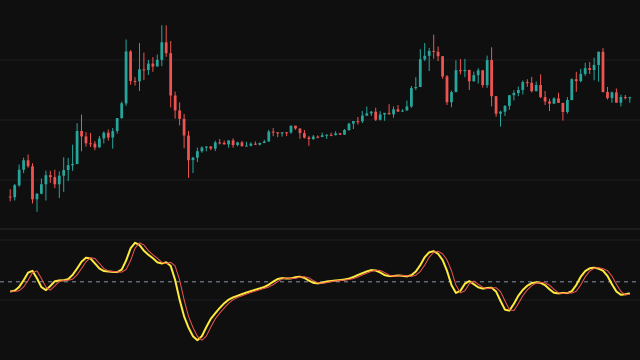
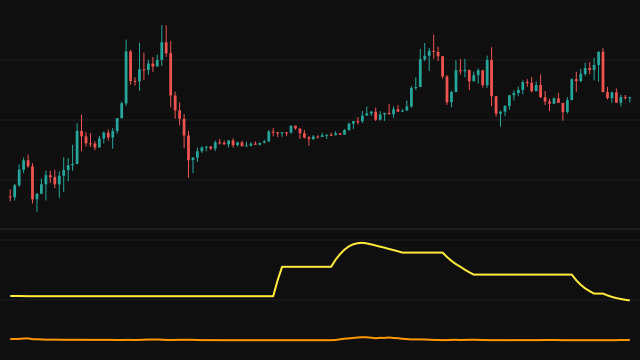
Center of Gravity treats the last Length prices like weights placed along a ruler. The current bar sits at position 1, the bar before it at position 2, and so on back to the oldest at position Length. Each price is multiplied by its position, the products are added, and the total is divided by the plain sum of the prices. The result is the balance point of the window, a position somewhere between 1 and Length.
The study plots that balance point minus the middle of the window, (Length + 1) / 2, so the line swings around zero. When recent prices are higher than older ones the weight shifts toward position 1 and the value drops below zero; when older prices are higher it rises above zero. Bars before the start of the chart count as zero, so the line answers from the first bar, and a window whose prices add up to zero reads as exactly zero.
How to read Center of Gravity (CG)
Read the turns rather than the level. Because the balance point shifts as soon as the newest prices change, the line turns near swing highs and lows with very little lag, and a turn from an extreme often coincides with a turn in price. The values are small and depend on Length and on the price level, so compare a reading with the line's own recent range rather than with a fixed threshold.
On the first Length bars the missing history counts as zero, which distorts the line; ignore that stretch. The study is most useful when price is cycling, and gives repeated small swings in a strong trend.
Settings
- Length
- Period for the Center of Gravity calculation. A longer length smooths the line and shifts it toward longer cycles.
- Source
- The price series the balance point is computed from.
Frequently asked questions
Why are the values so small?
The line is a position within the window measured from its middle, and with prices far from zero the balance point moves only slightly from the centre. Its turns matter more than its size.
Does a value below zero mean the market is weak?
It means the newer prices in the window are higher than the older ones, which pulls the balance point toward the current bar. It describes the shape of the window, not a bullish or bearish verdict.
Why is the start of the line strange?
Until Length bars exist, the missing bars count as zero, which shifts the balance point. The line is reliable once the window is full.