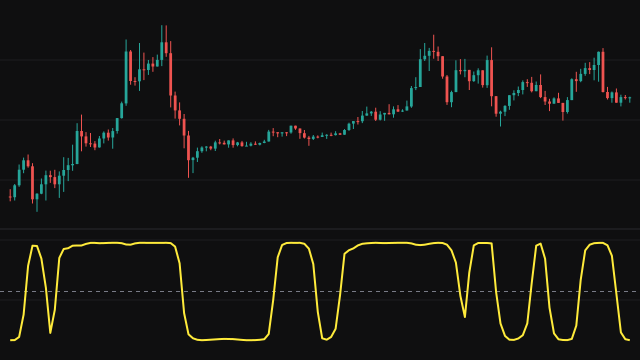
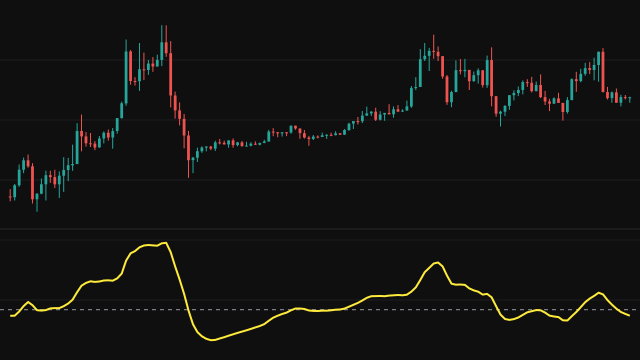
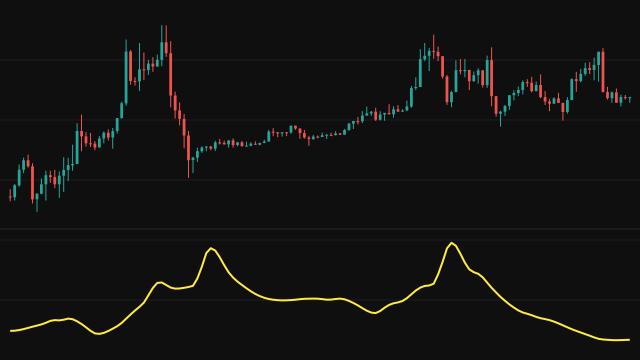
The Autocorrelation Periodogram estimates the market's dominant cycle length from a spectrum. Price first goes through a two-pole high-pass filter set by Max Period, which removes the trend, and a super smoother set by Min Period, which removes the fastest noise. The filtered series is then correlated with itself at every lag from 2 to Max Period, using a Pearson correlation over Autocorrelation Length bars, or over the lag itself when that length is zero.
A discrete Fourier transform turns that set of correlations into power at each period from Min Period to Max Period. Each bin is smoothed 0.2 / 0.8 against its previous bar and normalised by a running peak that decays slowly unless a new peak arrives; Enhance Resolution cubes the normalised power to sharpen the peaks. The Dominant Cycle is the power-weighted average of the periods holding at least half the peak, smoothed with a weight of 0.2. Normalized Power is the normalised power of the bin at that period.
How to read EACP: Ehlers Autocorrelation Periodogram
Read Dominant Cycle as the market's current rhythm in bars, and use it to set the length of oscillators and averages from the data. Normalized Power near 1 means that cycle stands out clearly in the spectrum; a low value means the reading is weak and the market is not cycling cleanly.
The opening stretch of the chart shows a large transient while the smoothing warms up, and the scaling that removes the seed feeds back into the state, so ignore the first few dozen bars. The estimate cannot report cycles outside the range you set.
Settings
- Source
- The price series the spectrum is computed from. The default is the close.
- Min Period
- The shortest cycle considered, in bars. It also sets the super smoother that removes faster noise.
- Max Period
- The longest cycle considered, in bars. It also sets the high-pass filter that removes the trend.
- Autocorrelation Length
- How many bars each correlation is averaged over. Zero uses the lag itself, which weighs long lags more evenly.
- Enhance Resolution
- Cube the normalised power so the strongest periods dominate and the dominant cycle reading is sharper.
Frequently asked questions
Why is the first part of the line so wild?
During warmup the smoothed dominant cycle is scaled to cancel its starting seed, and that scaled value feeds back into the next bar. The result is a large transient on the opening bars that settles once the warmup ends.
What does Normalized Power tell me?
How strong the reported cycle is relative to the strongest power seen recently. Near 1 the cycle is clear; a low value means the dominant cycle reading is weak.
Is it slow to compute?
It does more work per bar than most studies: a correlation at every lag and a transform at every period. With the default 8 to 48 bar range that is a few thousand steps per bar.