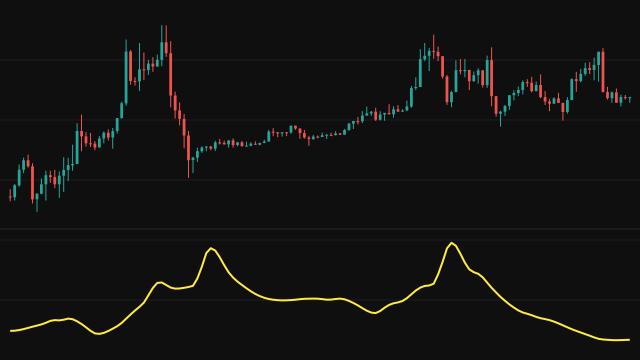
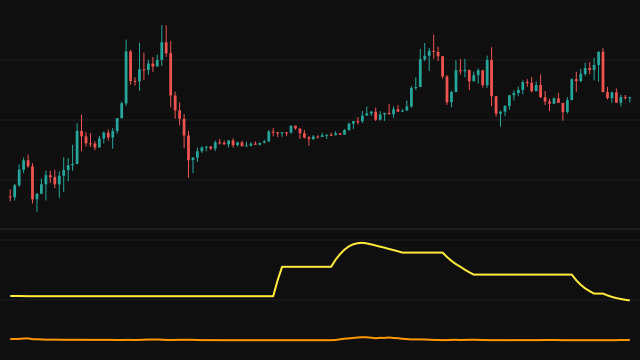
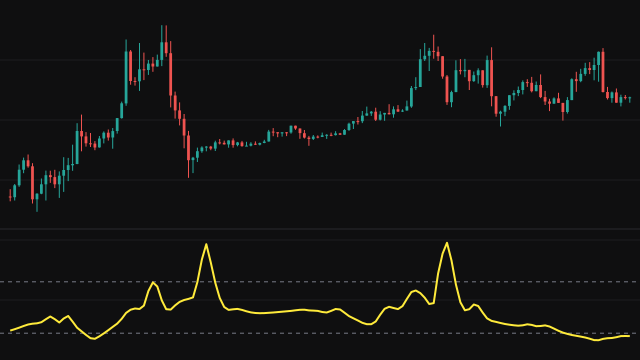
The Even Better Sinewave turns price into a bounded wave. A one-pole high-pass filter removes cycles longer than the High-Pass Filter Length, so the trend drops out. A two-pole super smoother, set by the Super Smoother Filter Length, then removes the fast noise from the two-bar average of that high-pass output.
The last step is an automatic gain control. The study takes the mean of the last three filtered values and divides it by the square root of their mean square, the wave's recent power. That ratio is held to the range -1 to +1. Because the result is divided by its own size, a quiet market and a volatile one both produce a wave of the same height, and the line reads as a position in the cycle rather than as a price distance.
How to read Ehlers Even Better Sinewave (EBSW)
Values near +1 mean the cycle is at or near a top, values near -1 mean it is at or near a bottom, and the zero line is the midpoint of the swing. In a market that is cycling, the line moves smoothly between the extremes and its turns from +1 and -1 mark swing highs and lows.
In a trend the wave tends to stick near one extreme for many bars. That flat stretch says the market is trending rather than cycling, so it is not a reversal reading.
Settings
- Source
- The price series the wave is computed from. The default is the close.
- High-Pass Filter Length
- Cycles longer than this many bars are removed as trend. A larger value keeps slower swings in the wave.
- Super Smoother Filter Length
- The smoothing applied after detrending. A larger value gives a smoother wave that turns later.
Frequently asked questions
Why does the wave stay pinned at +1 or -1?
The gain control divides the wave by its own power, so a steady one-way move keeps the ratio at an extreme. A wave that stays pinned means the market is trending, not cycling.
Is the value a price?
No. It is a ratio between -1 and +1, so it compares across instruments and timeframes, but it says nothing about how far price moved.
How do the two lengths interact?
The high-pass length sets the longest cycle kept and the smoother length sets the shortest. Keep the high-pass length well above the smoother length, or the band in between gets too narrow to hold a cycle.