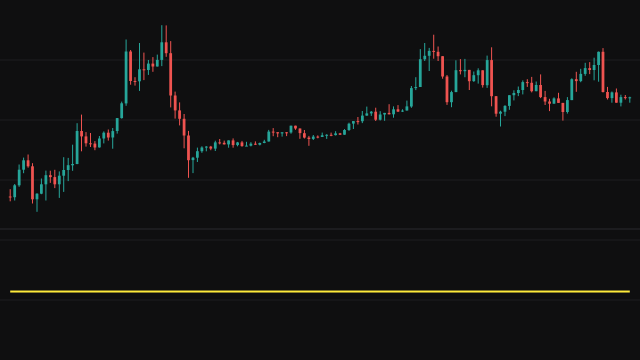
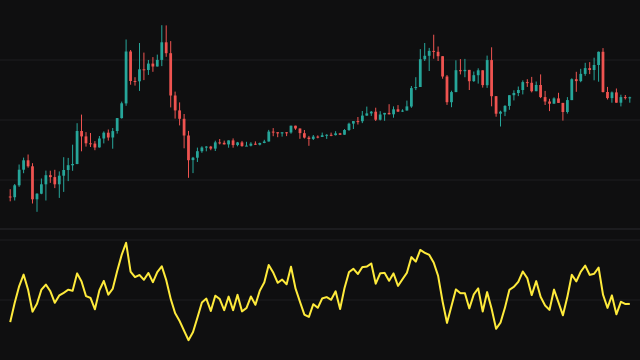
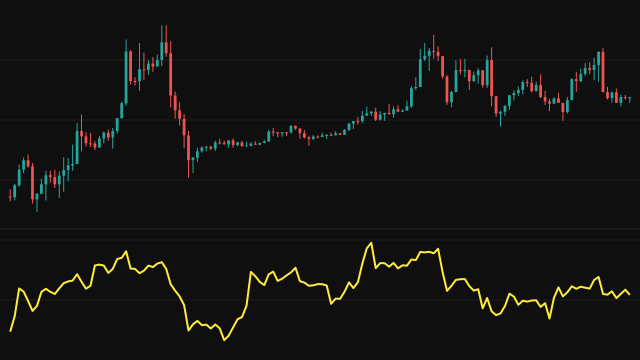
The CCI works on the typical price, (high + low + close) / 3. It takes the average of the typical price over the last Length bars, then the mean absolute deviation: the average distance of each typical price in the window from that average. The reading is (typical price - average) / (0.015 * mean deviation).
The constant 0.015 is chosen so that most readings fall between -100 and +100. The average is kept as a running sum, and before a full window exists both the average and the deviation use the bars seen so far, so the line starts on the first bar. When every typical price in the window is the same, the deviation is zero and the reading is 0.
How to read Commodity Channel Index (CCI)
Readings above +100 mean the typical price is unusually far above its recent average, and below -100 unusually far below. Traders use moves beyond those levels as signs of strength or weakness, a return inside them as a sign the move is fading, and crossings of zero as a change in which side of the average price is on.
The CCI has no upper or lower bound, so a strong trend can hold it beyond 100 for a long time. Read extremes against the instrument's own history and the trend, not as a fixed signal to reverse.
Settings
- Length
- How many bars the average and the mean deviation span. A longer window gives a smoother, slower line with fewer extreme readings.
Frequently asked questions
Why 0.015?
It scales the reading so that most values land between -100 and +100, which makes those two levels a convenient guide.
Is the CCI bounded?
No. A strong move can push it well past 200 or -200. The plus and minus 100 levels are a guide, not limits.
Why does the line start on the first bar?
Before the window is full, the average and the deviation use the bars seen so far. The first bar has no deviation and reads 0.