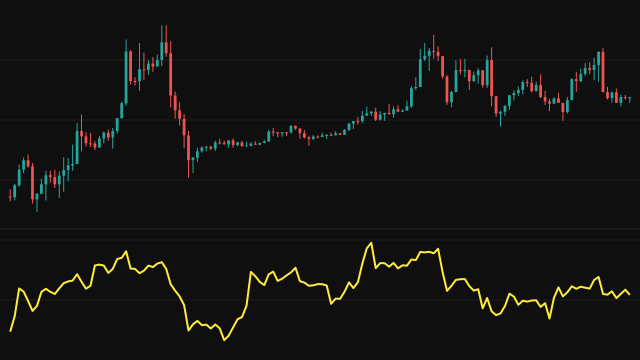
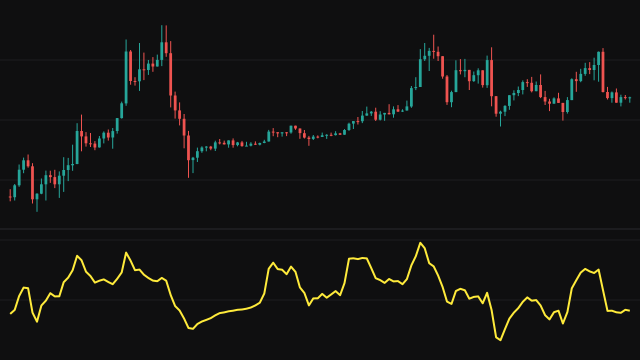
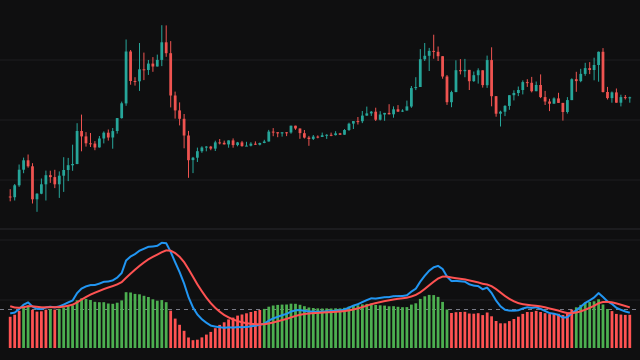
Composite Fractal Behavior looks at a ladder of lookbacks, 2, 3, 4, 6, 8, 12, 16, 24 bars and so on, two rungs for each step of depth, so the default depth of 10 has 20 rungs and its longest is 1,536 bars. For each rung it sets how far the current value sits from the earlier values in the window against the path between them, with each step's absolute change weighted by its distance from the newest bar. A straight run scores higher than a window price chops back and forth across. Each rung's score is scaled by how much of its window exists yet and smoothed by an exponential average of length length.
The rungs are then blended. Working outward on each of two interleaved sides, every rung takes the share the shorter rungs before it left over, and the rung lengths are averaged with the squares of those shares as weights. The result, at least 1, is smoothed twice by an adaptive moving average set by jmaPeriod and jmaPhase, then rounded up to a whole number of bars, never below 1.
One detail of the calculation dominates its output. The study keeps the last 2 + 2^(depth - 1) * depth * 2 values, 10,242 at the default depth. The last pair in every window joins the current value with the oldest of them, and until the chart has that many bars it joins it with zero instead. Paired with zero, the whole price level enters every score, the two shortest rungs take nearly all of the weight, and the reading settles at 3. On an hourly chart of about 1,500 bars it read 3 on nearly every bar at depths 7 to 10, and moved between 3 and 8 at depths 2 to 6.
How to read Composite Fractal Behavior (CFB)
The reading is a number of bars, rounded up. It rises above its usual value only when the longer rungs keep a share of the weight, which needs a clean, one-directional stretch inside their windows; a choppy market leaves it at the shortest rungs. It says nothing about direction: a clean fall scores like a clean rise.
Because the zero pairing described above holds the score of every rung near the same value, the line is flat at 3 on most charts at the default depth, and it varies only at shallower depths, where the oldest kept value is a recent price rather than zero or a price from far back. Treat a change in the reading as a sign that the short-window structure has changed, not as a measured trend length.
Settings
- Source
- The price each bar contributes. hlcc4, the default, averages the high, the low and the close counted twice. A missing value counts as zero.
- CFB Depth
- How many steps the ladder of lookbacks has, two rungs per step. It also sets how far back the oldest kept value lies, which decides whether the last pair of each window reads a real price or zero.
- Smooth Length
- The length of the exponential average applied to each rung's score before the rungs are blended.
- JMA Period
- The period of the adaptive average used for both final smoothings. Larger values give a steadier, slower line.
- JMA Phase
- Shifts the adaptive average between lag and overshoot, from -100 to 100. Positive values react faster and can overshoot turns.
Frequently asked questions
Why does the line sit at 3 most of the time?
Until the chart has as many bars as the study keeps (10,242 at the default depth), the last pair in every window compares the current price with zero. That brings the whole price level into each rung's score, so the two shortest rungs, 2 and 3 bars, take almost all of the weight and the rounded result is 3.
Does a high reading mean price is going up?
No. The scores measure how cleanly price has moved, in either direction. A steady fall scores the same as a steady rise.
Why is the value a whole number?
It is a length in bars, so the smoothed result is rounded up to the next whole bar, and it is never below 1.