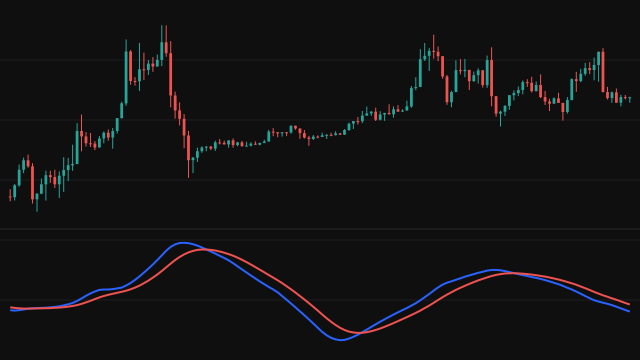
MACD measures trend and momentum as the distance between two exponential moving averages of the source. The MACD line is the fast average minus the slow one. The signal line is an exponential average of the MACD line over signalLength bars, and the histogram is the MACD line minus the signal line, green when it is zero or above and red when it is below.
The averages here start from zero and correct for that start. While the starting value still carries weight, each average is divided by (1 - e), where e is (1 - weight) raised to the number of bars seen, and weight is 2 / (length + 1). This removes the pull of the zero seed, so all three lines answer from the first bar instead of after a long warmup. Once every correction has decayed below 1e-10 the averages run as plain exponential averages.
How to read Moving Average Convergence Divergence (MACD)
When the MACD line is above zero the fast average is above the slow one, which is the shape of an uptrend; below zero is the shape of a downtrend. The histogram shows whether that gap is widening or narrowing: bars growing away from zero mean momentum is building, bars shrinking toward zero mean it is fading.
A MACD line crossing above its signal line flips the histogram from red to green, and many traders read it as momentum turning up; the opposite cross reads as momentum turning down. Crosses come late in fast markets and often whipsaw in sideways ones, so they read best alongside the direction of the larger trend.
Settings
- Fast Length
- The length of the fast exponential average. A shorter fast length makes the MACD line react sooner.
- Slow Length
- The length of the slow exponential average that the fast one is measured against.
- Signal Length
- The length of the exponential average of the MACD line that forms the signal line and sets the histogram.
- Source
- The price series both averages are taken over. Close is the default.
Frequently asked questions
Why does it draw from the first bar?
The averages start at zero and divide out the weight of that start while it still matters, so they give a usable value from the first bar instead of waiting for a seed window.
What do the histogram colours mean?
Green bars are zero or above, where the MACD line is at or above its signal line. Red bars are below zero, where it is under the signal line.
Is the reading comparable between instruments?
No. The MACD line is in price units, so its size scales with the instrument's price. The Percentage Price Oscillator gives the same gap as a percentage of the slow average.