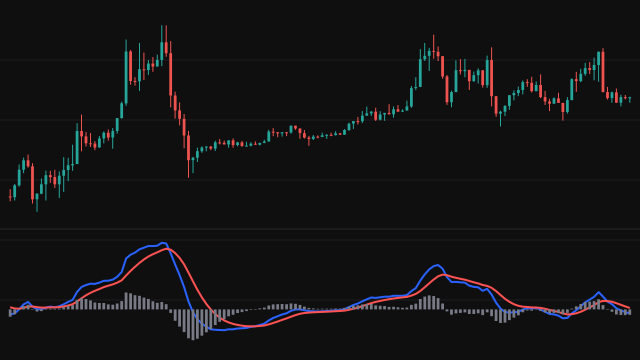
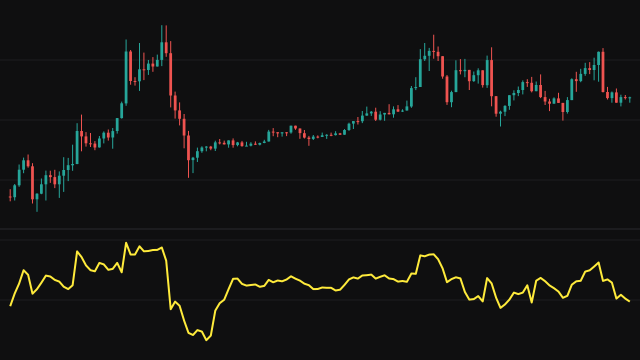
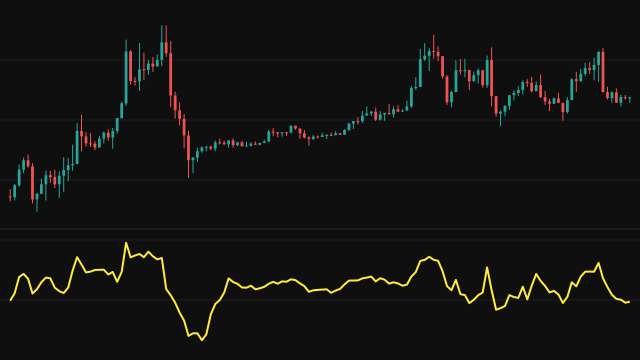
The Price Momentum Oscillator starts from the percentage rate of change of the source over rocLength bars: the source minus the source that many bars back, divided by the older value, times 100. Until the chart has rocLength bars the lookback reaches back only to the first bar, so the very first reading is zero.
That rate of change is smoothed by an exponential average of length smooth1, and the result is smoothed again by one of length smooth2. The second average is the PMO line. A third exponential average of the PMO over signalLength bars is the signal line. Each average uses the weight 2 / (length + 1) and starts from its first value, so both lines are drawn from the first bar.
How to read Price Momentum Oscillator (PMO)
The PMO is a smoothed momentum line. Above zero, price has been rising over the rate-of-change lookback; below zero, falling. The double smoothing removes most of the bar-to-bar noise, so a turn in the PMO is usually a real change in momentum rather than one odd bar.
A PMO crossing above its signal line is commonly read as momentum turning up, and a cross below as momentum turning down. Readings far from zero show a stretched move. Because the line is a percentage, its levels can be compared across instruments, though each instrument has its own normal range. The early bars reflect a shorter lookback and settle once the averages have seen enough data.
Settings
- Source
- The price series whose rate of change is measured. Close is the default.
- ROC Length
- How many bars back the percentage rate of change reaches before smoothing.
- First Smoothing Length
- The length of the first exponential average applied to the rate of change. Longer values give a smoother, slower line.
- Second Smoothing Length
- The length of the second exponential average, whose output is the PMO line.
- Signal Line Length
- The length of the exponential average of the PMO that forms the signal line.
Frequently asked questions
Why is the first reading zero?
On the first bar the lookback can only reach the first bar itself, so the rate of change is zero. The lookback grows with the chart until it reaches rocLength.
What does the signal line add?
It is a slower average of the PMO. Its crosses with the PMO mark the points where the smoothed momentum turns, and the gap between the two shows how firmly it is turning.