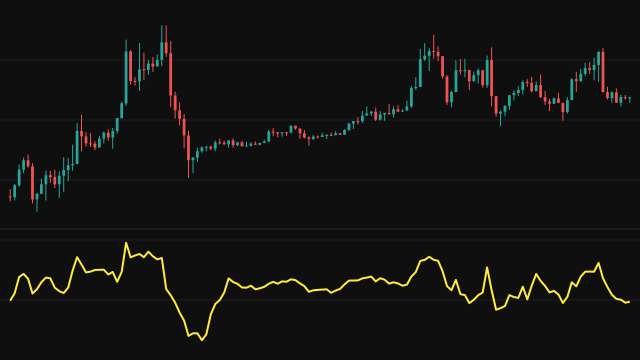
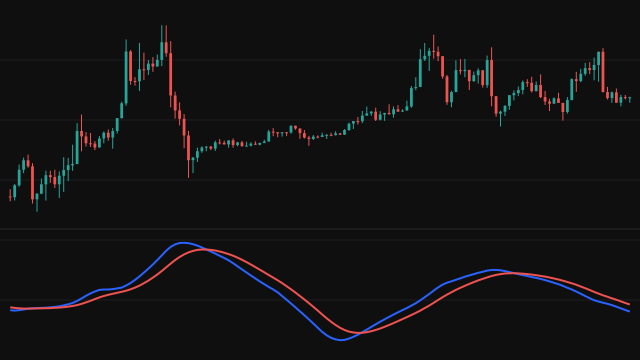
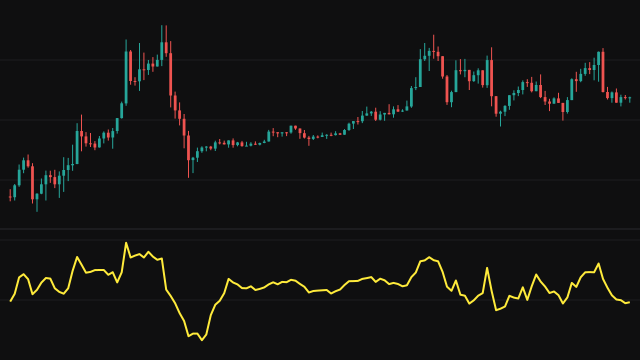
The Percentage Price Oscillator measures the same gap as MACD, the fast average minus the slow average, but divides it by the slow average and multiplies by 100. The result is a percentage, so it reads the same way on any price level. A signal line smooths the PPO, and the histogram is the PPO minus its signal.
The three averages here use a weight of 2 / length. Each starts with its accumulator at zero and returns the first value unchanged; after that the accumulator is divided by (1 - e), where e is (1 - weight) raised to the number of updates, until e drops below 1e-10. That correction removes the pull of the zero start, so every line answers from the first bar. A bar where the slow average is zero gives no PPO reading, and the signal keeps its last value there.
How to read Percentage Price Oscillator (PPO)
Above zero, the fast average is above the slow one by that percentage, which is the shape of an uptrend; below zero, it is the shape of a downtrend. A PPO of 1.5 means the fast average sits 1.5 percent above the slow one. The histogram shows whether the PPO is pulling away from its signal line or closing in on it.
A PPO crossing above its signal line, which turns the histogram positive, is commonly read as momentum turning up, and the opposite cross as momentum turning down. Because the reading is a percentage, it can be compared across instruments and across long stretches of history where price has changed level.
Settings
- Source
- The price series both averages are taken over. Close is the default.
- Fast Length
- The length of the fast average. A shorter fast length makes the PPO react sooner and swing further.
- Slow Length
- The length of the slow average, which is also the base the percentage is measured against.
- Signal Length
- The length of the average of the PPO that forms the signal line and sets the histogram.
Frequently asked questions
How is PPO different from MACD?
MACD is the gap between the averages in price units. PPO divides that gap by the slow average, so it is a percentage and compares across instruments and price levels.
Why do the averages use 2 / length?
That is the weight this calculation uses. It makes each average a little faster than one using 2 / (length + 1) at the same length.
Why does it answer from the first bar?
Each average divides out the weight of its zero start while that start still matters, so no seed window is needed.