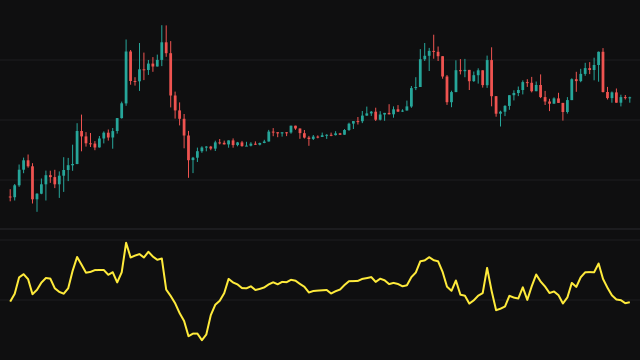
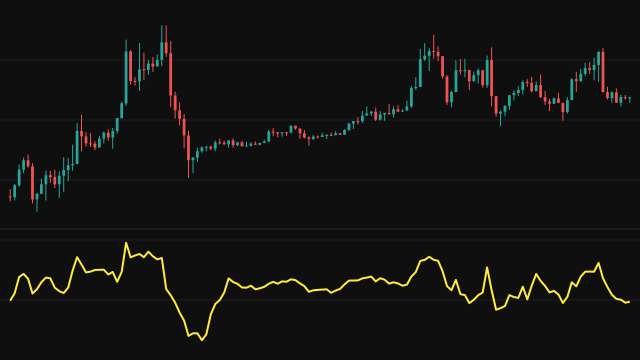
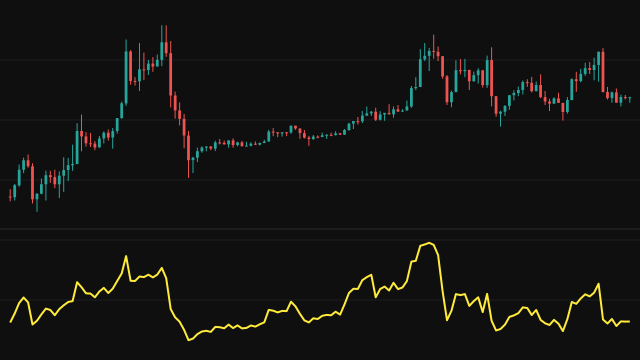
Rate of Change Percentage expresses the move over a lookback as a percentage of the older price. On each bar it takes the source, subtracts the reference value, divides by the reference and multiplies by 100.
The lookback starts at zero bars and grows by one on each bar whose reference value is present and not zero, until it reaches length. So the line begins on the first bar at zero instead of after a gap, and the early readings compare against the first bars of the chart. A reference of zero gives no reading on that bar and holds the lookback where it is.
How to read Rate of Change Percentage (ROCP)
A reading of 2 means price is 2 percent above where it was length bars ago, and a reading of -2 means it is 2 percent below. Because it is a percentage, the line reads the same way on a cheap instrument and an expensive one, and readings from different charts can be compared.
Watch the direction of the line as well as its sign: a falling line above zero means the advance is still there but slowing. The first length bars use a shorter lookback and are not comparable with the rest.
Settings
- Source
- The price series whose percentage change is measured. Close is the default; hl2 and the other blends soften bars with long wicks.
- Length
- The full lookback in bars. Longer lookbacks show larger, slower swings in the percentage.
Frequently asked questions
How does it differ from ROC and ROCR?
All three compare the same two prices. ROC gives the difference in price units, ROCP gives it as a percentage of the older price, and ROCR gives the ratio of the two.
Why are the first readings small?
The lookback grows from zero bars to length over the first bars, so the early readings measure a shorter move.